The COVID-19 pandemic disrupted the use of space over the last three years, boosting demand for residential and industrial space and suppressing demand for office space. As supplies have remained limited, affordability in residential real estate has declined alongside higher interest rates, resulting in new demand for rental space. In industrial markets, increasing demand has spurred construction and reduced vacancy rates. In contrast, demand for office space has weakened as people have spent more hours at home. Strong demand amid limited supplies has led to strong price growth in residential and industrial real estate markets, while conditions have been somewhat weaker in the market for office space.
Residential Real Estate
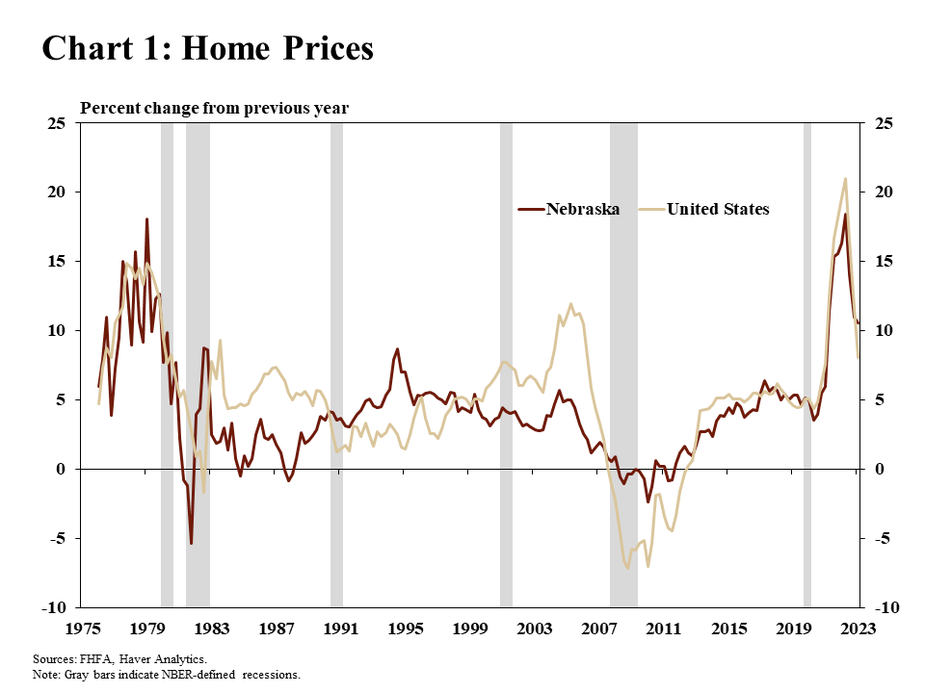
Home prices in Nebraska have continued to increase, but growth has slowed from recent highs. The median home in Nebraska increased in value by 10.5% in the first quarter relative to last year, slightly higher than the national rate (Chart 1). While the increase in Nebraska has fallen considerably from the record pace of 2022, home value increases above 10% are still historically high. Homes had not consistently increased in value by 10% or more since the 1970s.
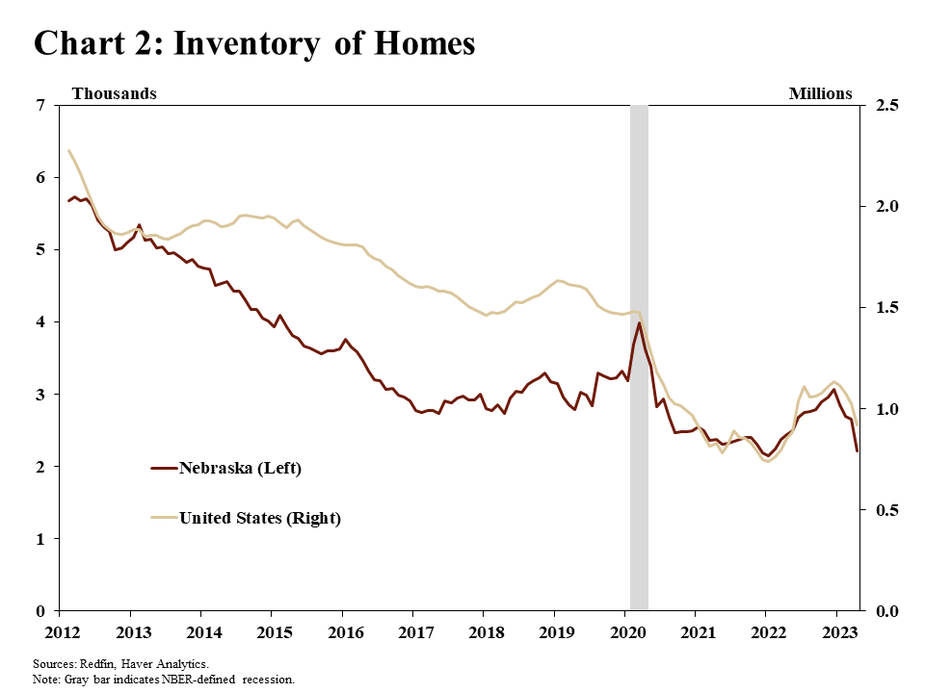
Through early 2023, the supply of homes in Nebraska was significantly less than before the pandemic, supporting continued price growth. The inventory of homes in Nebraska and nationwide has trended downward since at least 2012. As interest rates began to rise in 2022, the inventory of homes began to increase, nearing 3,000 homes actively listed at the end of the year (Chart 2). Despite the increase in inventory, the supply of homes at the end of the year remained less than the months leading up to the pandemic. In the early months of 2023, the inventory of homes began to fall again, nearing the historic lows of late 2021.
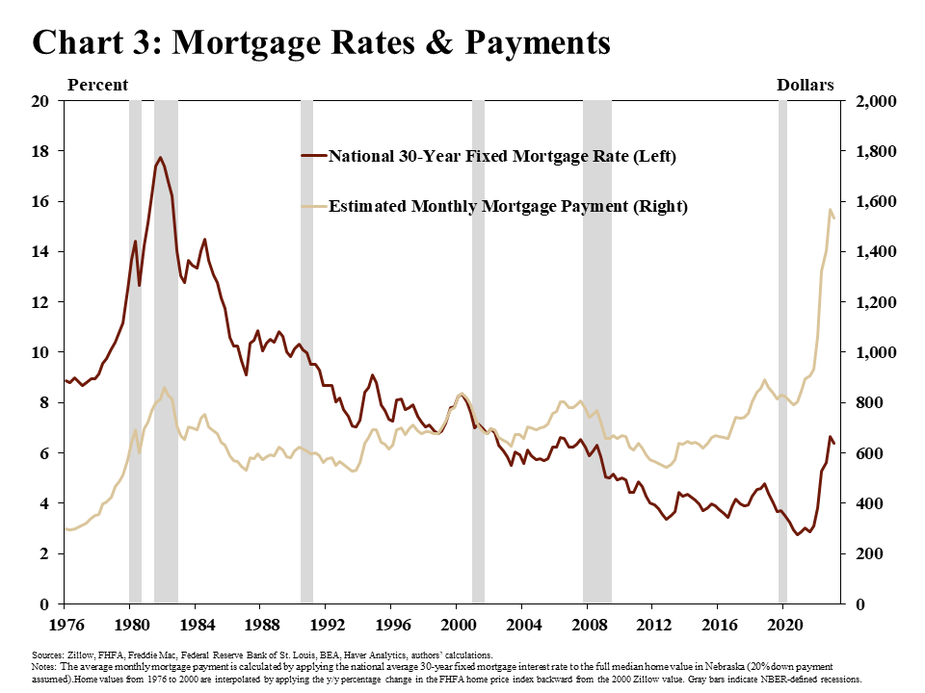
As both home prices and interest rates have risen, housing affordability has become more challenging. By the first quarter of 2023, the median monthly mortgage payment in Nebraska had risen from $812 per month in 2019 to more than $1,500 per month (Chart 3). Until recently, mortgage rates had steadily declined from more than 17.7% for a 30-year fixed mortgage in 1982 to less than 3% in 2021. The downward trend in mortgage rates counteracted the steady increases in home prices, keeping mortgage payments relatively consistent over time. The recent increase in interest rates, however, has occurred alongside significant increases in home prices, resulting in mortgage payments nearly double their long-run level.
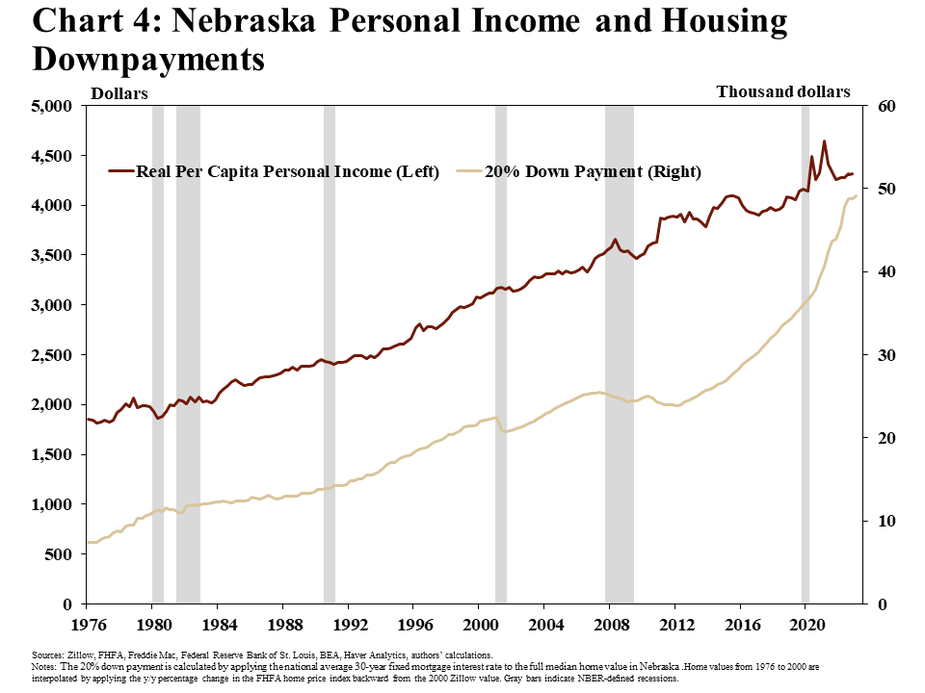
While affordability has worsened relative to recent years, growth in personal income has helped offset some of the impacts of reduced affordability. Though a mortgage payment on a home purchased in early 2023 was approximately 80% higher than 1982, real (inflation-adjusted) incomes rose by more than 115% over the same period (Chart 4). While higher incomes have also allowed some home buyers to save for a down payment, the rapid increase in home prices in recent years has led to a notable increase in the dollar amount of a traditional 20% down payment. In the first quarter of 2023, a 20% down payment on a (median) home in Nebraska was nearly $50,000, up from $36,000 in 2019.
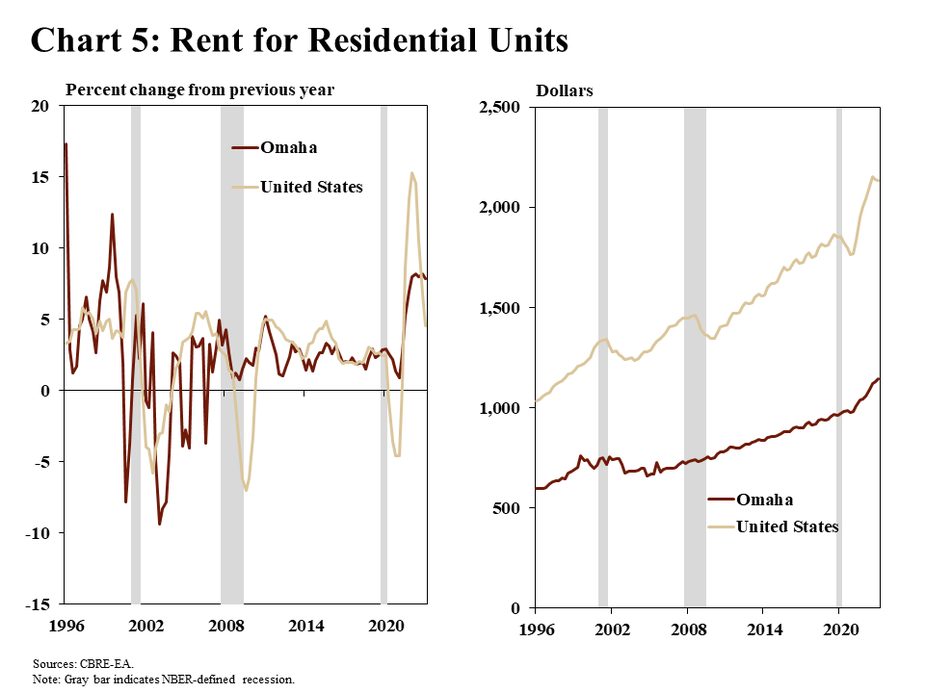
With reduced affordability of single-family homes, more people have sought to rent their primary dwelling, pushing up rental prices. In the first quarter of 2023, rents in Omaha were nearly 8% higher than the previous year (Chart 5). While an increase of 8% in Omaha was historically high, rental prices elsewhere in the nation grew even faster. Thus, despite substantial increases, rents remain more affordable in Omaha relative to the United States as a whole. While median rent in Omaha was approximately $1,100 in the first quarter of 2023, median rent nationwide was nearly $1,000 higher.
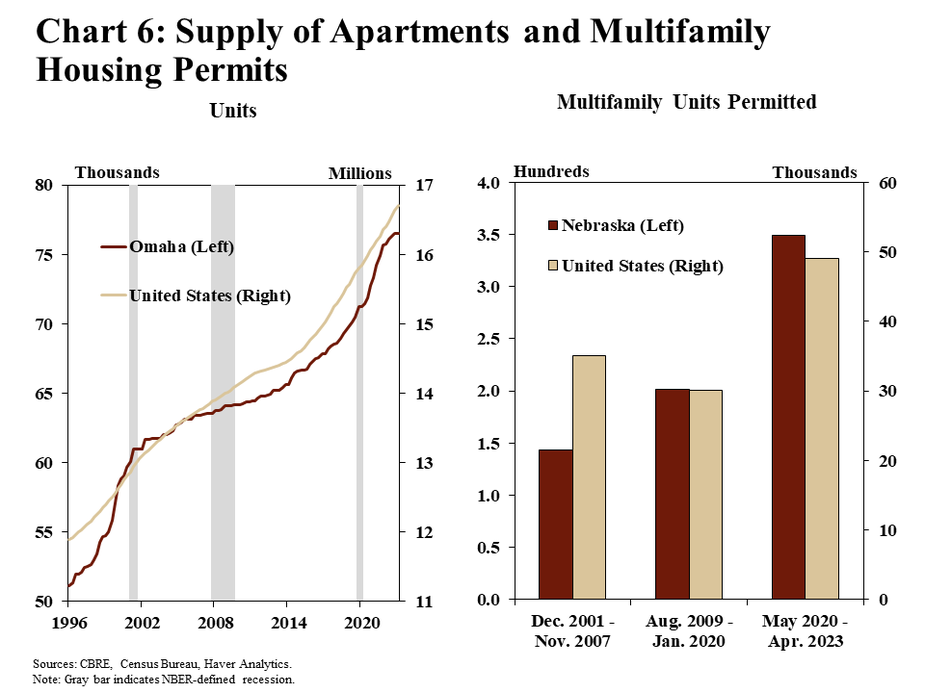
In response to strong demand for housing, additional apartment space has been added to the market. Since the end of the financial crisis in 2009, apartments available for rent have increased by more than 18% in Omaha to more than 76,000 units by early 2023 (Chart 6, left panel). As the affordability of home purchases declined after the pandemic, demand for multifamily rental space increased. New permits for units in multifamily buildings increased dramatically after the short, pandemic-induced recession in early 2020. Since May 2020, an average of nearly 350 units have been permitted per month in Nebraska. The average number of permits issued since the pandemic in Nebraska far exceeds the number issued during both of the previous two economic expansions.
Commercial Real Estate: Industrial
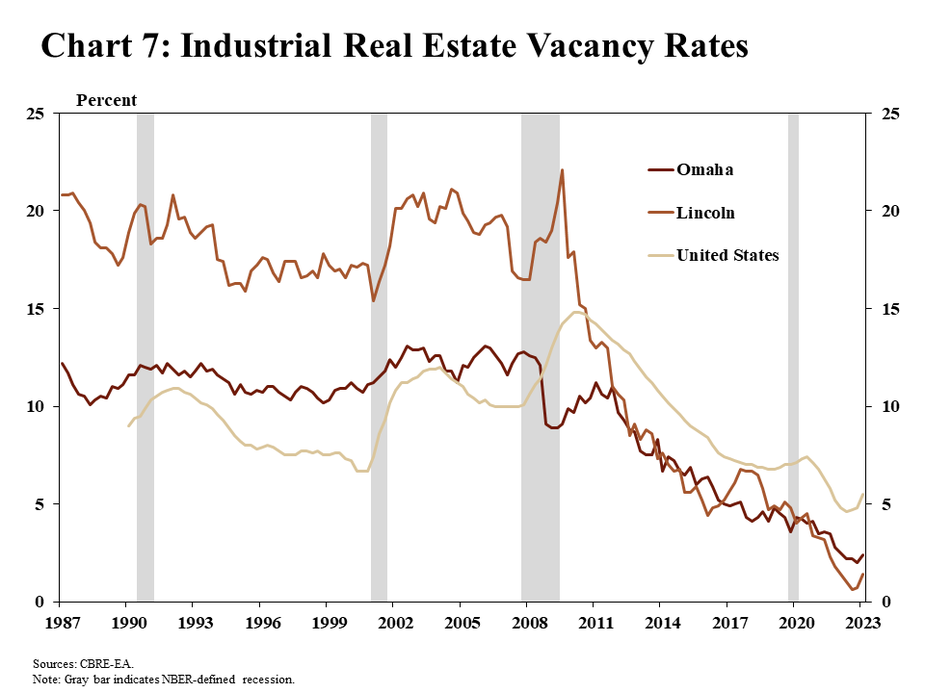
Similar to residential real estate, the market for industrial real estate has also continued to perform well. Demand for industrial space has been strong, driving vacancies to all-time lows. As in the nation as a whole, vacancy rates have consistently fallen in both Omaha and Lincoln. Since the end of the financial crisis, vacancy rates for industrial real estate have fallen by 7 percentage points in Omaha and nearly 21 percentage points in Lincoln (Chart 7).
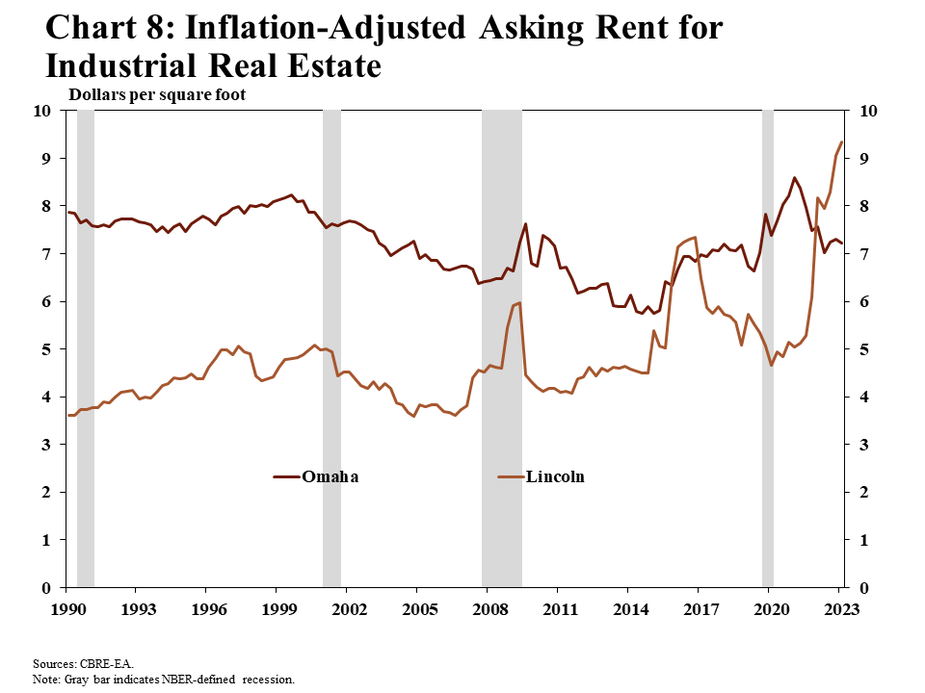
In response to strong demand, the cost of industrial space has risen in recent months. Asking rents have trended upward for decades, similar to most real estate markets. After adjusting for inflation, rents began to grow more quickly around 2015 (Chart 8). Since 2015, rental rates per square foot have increased by more than 25% in Omaha, similar to that of the nation. In Lincoln, inflation-adjusted rent for industrial real estate has more than doubled since the beginning of the pandemic. Increased demand for warehousing space and data storage has likely contributed to rent appreciation in local markets.
While conditions have been strong locally, other transit hubs and port locations have added even more industrial space than Omaha and Lincoln. Net absorption accounts for both reductions in existing vacancies and new space completed. While Omaha ranks 56th among metro areas nationally in terms of total square footage absorbed, its footprint of industrial space more than doubled from approximately 4 million square feet in the three years before the pandemic to more than 9 million square feet since the beginning of 2020 (Chart 9).

Commercial Real Estate: Office
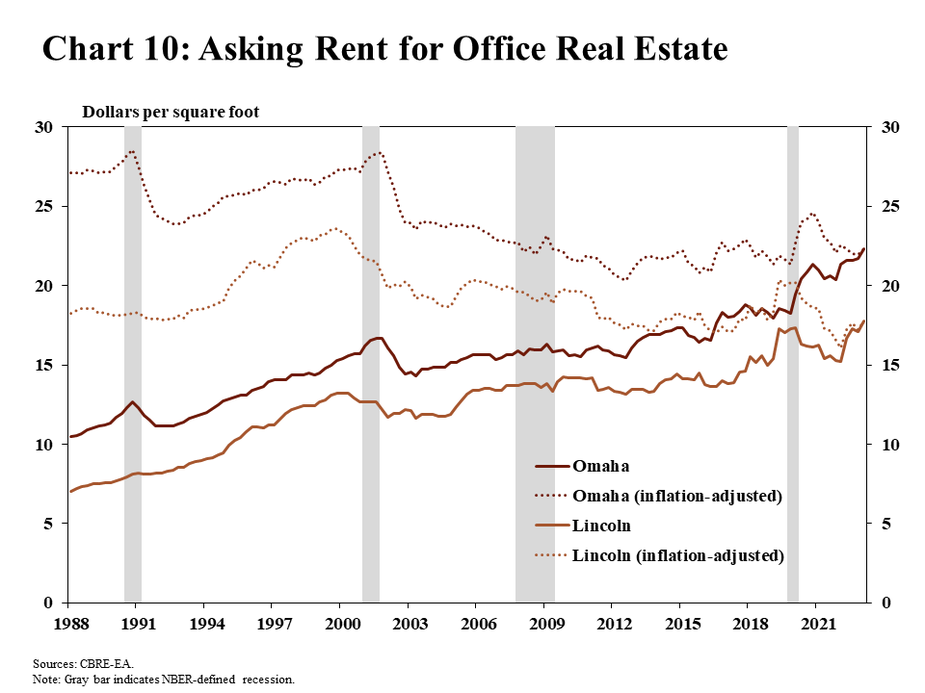
Unlike residential and industrial real estate markets, demand for office space has been weaker in the wake of the pandemic. As in residential markets, rents for office space have continued to increase in major Nebraska markets. However, in inflation-adjusted terms, rents have been steadily trending downward for about a decade, signifying a relative balance in supply and demand for office space. For instance, in Omaha, asking rent per square foot of office space increased by nearly 15% between the end of the financial crisis and the end of 2019, and an additional 14% between the beginning of the pandemic and the first quarter of 2023 (Chart 10). After adjusting for inflation, however, rents declined in Omaha in both periods.
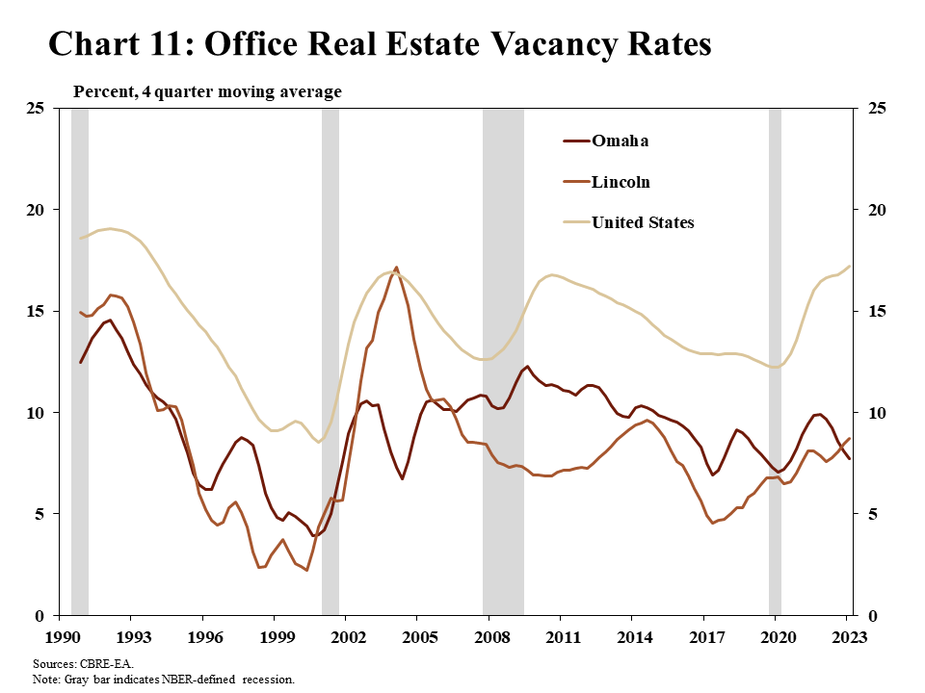
Office vacancy rates in major Nebraska markets have generally been stable, further pointing to a relative balance of supply and demand in the market. For the United States as a whole, vacancy rates have increased more than five percentage points since the onset of the pandemic (Chart 11). In contrast, vacancy rates in Nebraska have remained similar to pre-pandemic levels. An External Linkongoing survey and research from the PDFFederal Reserve Bank of Kansas City on the stance of work-from-home policies suggest that companies in cities the size of Omaha and Lincoln may be asking employees to spend more days working in the office. Stability in vacancy rates for small and mid-size cities like Omaha and Lincoln could be linked to higher office utilization rates, keeping supply and demand closer to their long-term balance.
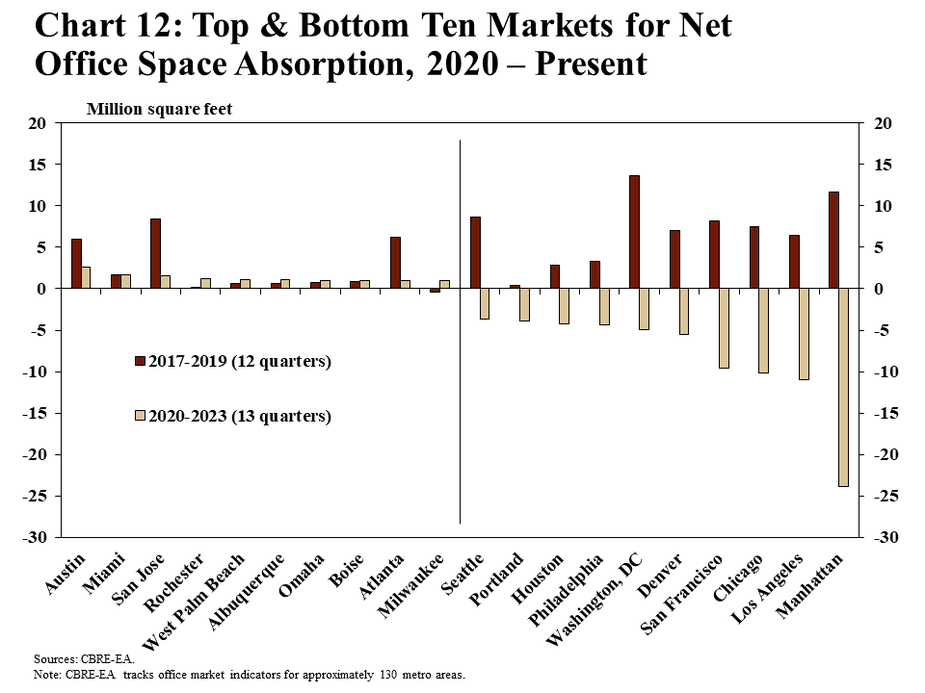
Reflecting relative balance between supply and demand, markets like Omaha have been able to absorb new office space more efficiently than other metros across the country. In fact, since the beginning of the pandemic, Omaha has absorbed the 7th most square footage of office space across metro areas (Chart 12). As in industrial markets, absorption accounts for both new office completions and changes in existing office vacancies. The high degree to which Omaha has absorbed office space may be related to regional differences in work-from-home policies. Most cities that have successfully absorbed office space since 2020 are similarly small- or mid-sized cities like Omaha. In contrast, the markets that have struggled with vacant office space have tended to be the nation’s largest cities.
Conclusion
In key real estate sectors in Nebraska, prices remain elevated as demand has generally outpaced supply. Finding balance between supply and demand will likely take some time as the economy continues to find its footing after the pandemic. Currently, limited supplies of residential real estate pose some affordability challenges for potential new homebuyers. In commercial real estate markets, strong demand for industrial space appears likely to continue supporting prices and new development. Despite some growing concerns about weakness in the office segment of commercial real estate, however, Nebraska’s markets have generally been stronger than more urban locations elsewhere.
References
Brown, Jason and Colton Tousey, 2023. “The Shifting Expectations for Work from Home.” Federal Reserve Bank of Kansas City, Economic Review.
Barrero, Jose Maria, Nicholas Bloom, and Steven J. Davis, 2021. “Why working from home will stick,” National Bureau of Economic Research Working Paper 28731.