Investments within the energy sector play a significant role in the regional economy of the Rocky Mountain states and surrounding areas, particularly compared with many other parts of the United States. The footprint of the energy sector on the regional economy historically has been associated with traditional energy activities involving oil and gas, coal and other mining activities. Yet, the overall energy sector has begun to diversify, incorporating wind, solar and other technologies into electricity production. As the region utilizes more renewable energy, and capacity grows in coming decades, the regional footprint of energy investment has the potential to shift over time. In this issue of the Rocky Mountain Economist we show the regional differences in renewable energy investment in recent years, disparities in planned growth of renewable energy capacity and highlight the renewable resource base that attracts these investments to the region.
Regional Footprint in Energy Investment Activity
The Rocky Mountain region and surrounding areas are home to a sizable share of activity in the U.S. energy sector. Colorado hosts several energy company headquarters and is home to the southern Niobrara oil and gas drilling basin. Wyoming is home to the northern Niobrara basin and is also a historically important location for coal production. The Permian Basin in southern New Mexico is among the most productive oil and gas plays in the U.S.1 To provide some context on how energy intensive the Rocky Mountain region is, Colorado residents make up less than 2% of the U.S. population, yet the state hosts about 4% of total U.S. energy production. Wyoming has a mere 0.2% of U.S. population, but produces 7% of total energy with an outsized concentration in coal. Even though New Mexico has less than 1% of the U.S. population, more than 11% of all U.S. crude oil production and nearly 5% of natural gas production are located within the state.2 By any measure, the Rocky Mountain region is an energy intensive area of the U.S.
The addition of renewable sources of energy is associated with a shift in many energy sector activities, which could alter the geographic footprint of the sector in coming decades. The new technologies, utilization of new resources such as wind and solar, alternative modes of transmitting energy to customers, storage systems, and the manufacture of all of the above each have the potential to relocate portions of the energy sector throughout the U.S. In short, the concentration of new energy activities may shift in various ways from historical regional energy concentrations.
Despite these potential shifts, the Rocky Mountain region and surrounding states are maintaining prominence as energy intensive locations even as the sector diversifies, capturing a disproportionate share of renewable energy production capacity added in recent years. The Energy Information Administration (EIA) provides information on the dollar value of renewable investments in generation capacity for wind, solar, hydroelectric, pumped storage, battery storage, wood, biomass and geothermal.3 Combined, the Rocky Mountain region makes up 2.6% of the nation’s population but claims 4.5% of installed renewable energy capacity. Looking to surrounding states in the region represented by the Federal Reserve Bank of Kansas City (the seven states of the Tenth District: Colorado, Kansas, Missouri, Nebraska, New Mexico, Oklahoma and Wyoming), nearly 13% of U.S. renewable capacity is located in the region despite having only 7% of the U.S. population.
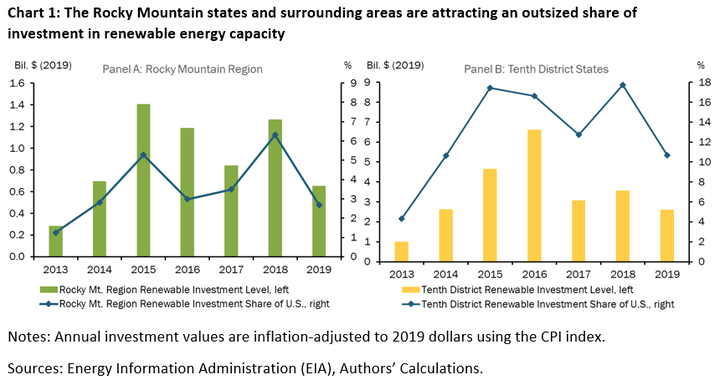
To achieve these outsized contributions in renewable generation capacity both the Rocky Mountain region and Tenth District have attracted large shares of investment in renewable technologies in recent years.4 Chart 1 shows investments in renewable sources of energy within the Rocky Mountain region between 2013-19 in panel A; panel B shows investments over the same period within the Tenth District’s states. Although the dollar amounts of renewable investments have ebbed and flowed since 2013, both the Rocky Mountain region and the Tenth District have received an outsized share of renewable investments, shown by the blue lines in each panel. The Rocky Mountain states attracted 3.5% of total U.S. renewable investment while the Tenth District captured of 13% of U.S. renewable investments on average between 2013-19.5
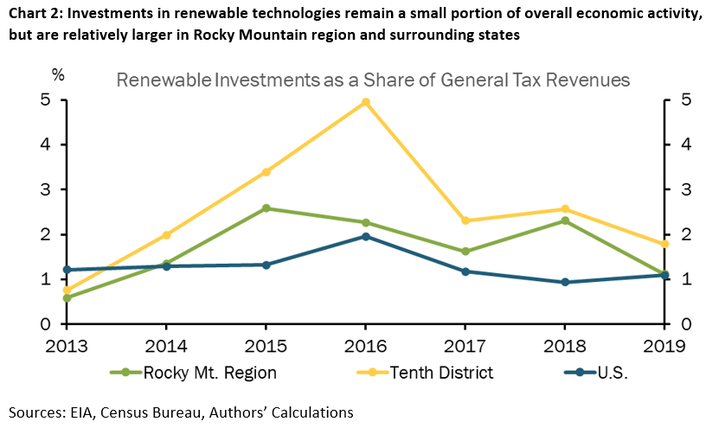
Investments in renewable energy technologies are a small share of regional and national economies overall. For comparison, the Rocky Mountain region attracted investments in renewable sources of energy production equivalent to only 1.7% of general state tax revenues between 2013-19, and were roughly 2.5% of Tenth District general revenues (Chart 2). Though small, investments in the Rocky Mountain region as a share of the respective state’s general revenues were roughly in line or slightly ahead of the 1.3% share for the U.S., while the Tenth District outpaced U.S. renewable investments in nearly every year since 2013.
Regional Investment in Renewables: Past, Present and Future
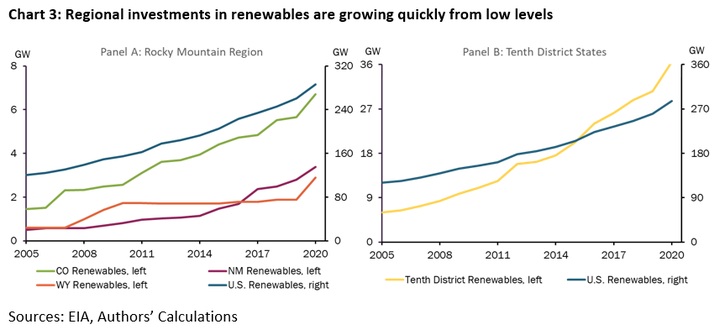
The Rocky Mountain region has not always been a prominent destination for investments into renewable energy production capacity. Those gains have accelerated only in recent years for several states. Renewables are expected to grow relatively more swiftly across the region in coming years compared with the U.S. average. To illustrate the recent growth, Chart 3 shows the share of U.S. renewable capacity in the Rocky Mountain states (panel A) and in the Tenth District (panel B) during 2005-20. Over the last five years, renewable capacity grew 52% in Colorado, 131% in New Mexico, 69% in Wyoming and 81% in the Tenth District. These recent growth rates are all much faster than across the U.S., generally, but the high growth rates are partially attributable to the low starting point for renewable adoption in these areas near the turn of the century.
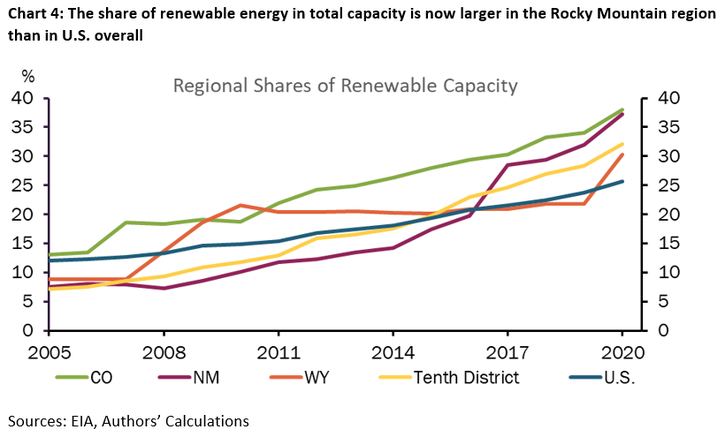
With the growth rates in renewable investment activity over the last five years, the three Rocky Mountain states and other Tenth District states now surpass the U.S. average for renewable energy capacity. Chart 4 shows renewable capacity share of total electricity capacity from 2005-20. Colorado consistently exceeded the U.S.’s renewable penetration. Wyoming’s renewable penetration moved sporadically, exceeding the U.S.’s renewable share in 2008-16, falling behind in 2017-19, and then surging ahead of the U.S. in 2020. Whereas New Mexico and the Tenth District only started to surpass the U.S. in the last five years. More than one third of the region’s total energy capacity was from renewable sources in 2020 compared with 26% for the U.S. overall.
Energy suppliers’ announced plans for future projects suggest adoption of renewable technologies in both Rocky Mountain states and the Tenth District is likely to outpace the rest of the U.S. in coming years. Chart 4 shows the expected growth in renewable capacity and the share of capacity additions in renewables over the next five years based on reports energy suppliers must submit to the EIA.6 All three Rocky Mountain states and the Tenth District have expected renewable growth rates exceeding the U.S., as shown in the blue bars. In Colorado, renewable capacity is expected to grow about 36%. New Mexico and Wyoming are expected to nearly double renewable capacity, while the entire Tenth District is expected to see renewable capacity grow 40%. These figures surpass plans for growth in renewables of 30% across the U.S. over the same period.
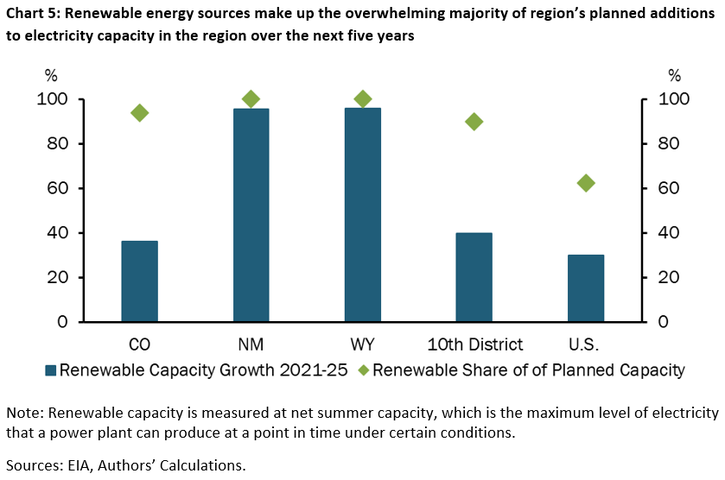
The overall composition of electricity capacity is also expected to move more toward renewables in the Rocky Mountain region and the Tenth District. Nearly all of planned capacity additions in Colorado (93%) and the Tenth District (90%) are renewable over the next five years, as indicated by the green dots in Chart 5. Fully 100% of planned capacity in electricity production in New Mexico and Wyoming are in renewables over the next five years. These planned additions significantly exceed those for the U.S., which has 62% of planned capacity additions in the renewable category. Electricity capacity is likely to diversify with the addition of renewable energy production, and the pace at which renewables are incorporated into that production is likely to be quicker in the Rocky Mountain region and Tenth District, compared with the U.S.
Regional Resource Base in Wind and Solar
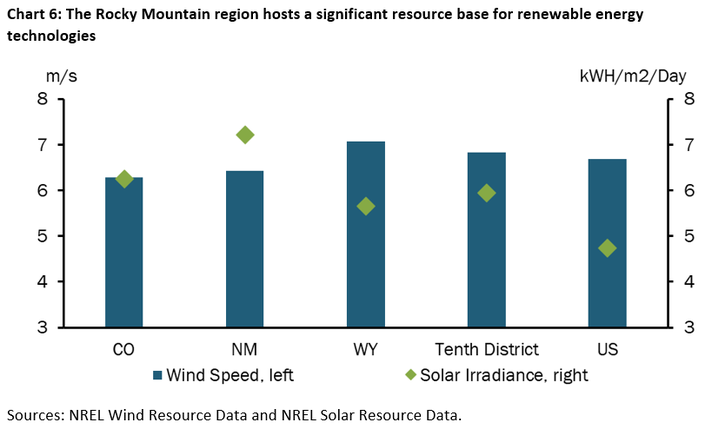
Investment in renewable energy production is aimed at the Rocky Mountain region and surrounding states for many reasons, not least of which is the availability of a significant resource base. According to the EIA, most planned capacity additions are expected to utilize wind and solar technologies over the next five years, making the exposure to wind and solar resources important factors contributing to overall renewable adoption.7 Chart 6 shows the wind and solar resource base for the Rocky Mountain states and Tenth District compared with the rest of the country.8 Colorado and New Mexico have roughly the same wind intensity as the U.S., while Wyoming is more windy on average. The Tenth District is slightly windier than the U.S. average, indicated by the blue bars. Solar intensity, shown by the green dots, is greater across the entire region compared with the U.S. average.
Regional Spillovers from Energy Activities May Shift
Regardless what factors direct investment in renewables to the Rockies and surrounding areas, the consequences of these new capital inflows for local economies are likely to differ from previous expansions in energy activities. First, compared with traditional oil and gas extraction, investments into renewable sources of energy require relatively higher upfront costs to install generation capacity, and require relatively fewer workers over the active lifetime of the windmills and solar farms that make up much of the region’s renewable investments.
Second, the materials and technologies underlying renewable energy production also differ from oil and gas drilling or coal mining. As a result, upstream suppliers of renewable energy inputs are not the same and may have different geographic footprints regionally, nationally and internationally. For example, traditional oil and gas drilling activities require significant ongoing investments into commonly sourced steel piping, concrete and transportation equipment, some of which is accessible domestically and is located near areas where fossil fuel production occurs. The supply chains for renewables are different. Most global manufacturing of solar panels is located in China; of the manufacturing that is in the U.S., it is concentrated in midwestern and southeastern states.9 Although, most U.S. wind components are built domestically, much of that manufacturing is concentrated in eastern and southern regions of the U.S.10 Further up the supply chain, the mineral inputs for renewable energy technologies are more exotic than for traditional energy sources, with origins largely outside the U.S.11 For these reasons, a redrawing of energy supply chains across regional economies may occur as the sector diversifies by adding more renewable energy sources.
A third and significant difference is the infrastructure for transmitting energy to customers. While the regional economies of the Rocky Mountain area and surrounding states host both renewable and traditional energy resource bases, specific locations of wind and solar generation differ from current locations of electricity generation plants. An augmented infrastructure is needed to incorporate new generation locations onto the power grid. Again, these investments may alter the local footprint of how energy is delivered to consumers.12
Looking past the initial investments in renewable energy production, a fourth reason the local economic effects may differ as the sector diversifies is the current manner of how the value derived from renewable energy production is owned and taxed. In New Mexico and Wyoming, for example, severance taxes on oil and gas activities make up a sizable share of total tax revenues. As the composition of energy production transitions over coming decades, the severance tax regimes adopted for that new composition will have implications for state revenues. Similarly, owners of the energy produced by renewable resources will be affected. Research by Brown and co-authors highlights the fact that severance payments to owners of oil and gas resources are often made to individuals located elsewhere, and that those payments then spread the economic spillovers from oil and gas activities to the local economies where the owners reside.13 If the beneficiaries of renewable energy production are in different parts of the region or country, then we should expect some of the spillovers from this activity to also relocate in coming years.
_________________________
1EIA Drilling Productivity Report.
2EIA State Profiles and Energy Estimates.
3Specifically, these data on capacity and investment are compiled from the EIA-860 Survey data.
4EIA State Profiles and Energy Estimates, EIA-860 Survey.
5We combine the Rocky Mountain region (Colorado, New Mexico, Wyoming) and Tenth District (Colorado, Kansas, Missouri, Nebraska, New Mexico, Oklahoma and Wyoming) renewable investment information due to data restrictions and availability on generator investments.
6We use capacity rather generation as a measure of size of the electricity sector, as it allows for a comparison across electricity generation technologies, for both renewables and non-renewables.
7EIA-860 Survey, EIA Today In Energy – “Renewables Account for most new Electricity Generating Capacity in 2021”.11Jan2021.
8Wind speeds are based on annual average wind speeds 80 meters above surface level (the height of the average wind turbine) and solar irradiance is based on the annual average direct normal irradiance. Thank you to Cortney Cowley of the KC Fed for calculating the average wind and solar intensities by state and region.
9NREL/DOE “H2 2020 Solar Industry Update” (External Linklink); DOE “Solar Manufacturing” (External Linklink)
10DOE “10 Things You Didn’t Know About Wind Power” (External Linklink); DOE “Wind Manufacturing Supply Chain” (External Linklink)
11USGS “Critical Mineral Commodities in Renewable Energy” (External Linklink)
12EIA “U.S. Energy Mapping System” (External Linklink)
13"Does Resource Ownership Matter? Oil and Gas Royalties and the Income Effect of Extraction" by Jason P. Brown, Timothy Fitzgerald and Jeremy G. Weber, Journal of the Association of Environmental and Resource Economists, 2019, 6(6): 853-878.