Financial conditions in the Tenth District farm economy remained solid in the second quarter, but survey contacts reported signs of slower growth that appeared likely to continue in the coming months. Following rapid gains in farm real estate values in recent quarters, valuations moderated in the second quarter alongside recent declines in agricultural commodity prices. Farm income remained stronger than a year ago, but an increase in farm loan interest rates, drought, higher input costs, and the pullback in commodity prices likely contributed to a slightly less optimistic outlook on the farm economy than in the previous quarter.
While the outlook for the District agricultural sector in 2022 has remained positive, lenders reported growing concerns about 2023. A larger share of lenders reported significant increases in production expenses for producers compared to last year. In addition, several respondents commented that severe drought has reduced hay and forage for livestock and contributed to higher feed costs. Despite these concerns, farm loan repayment problems declined to the lowest level in more than 7 years, and more than half of survey respondents expected farm income to increase or remain unchanged in 2023, highlighting continued strength in the financial position of farm borrowers.
Section 1: Farmland Values and Interest Rates
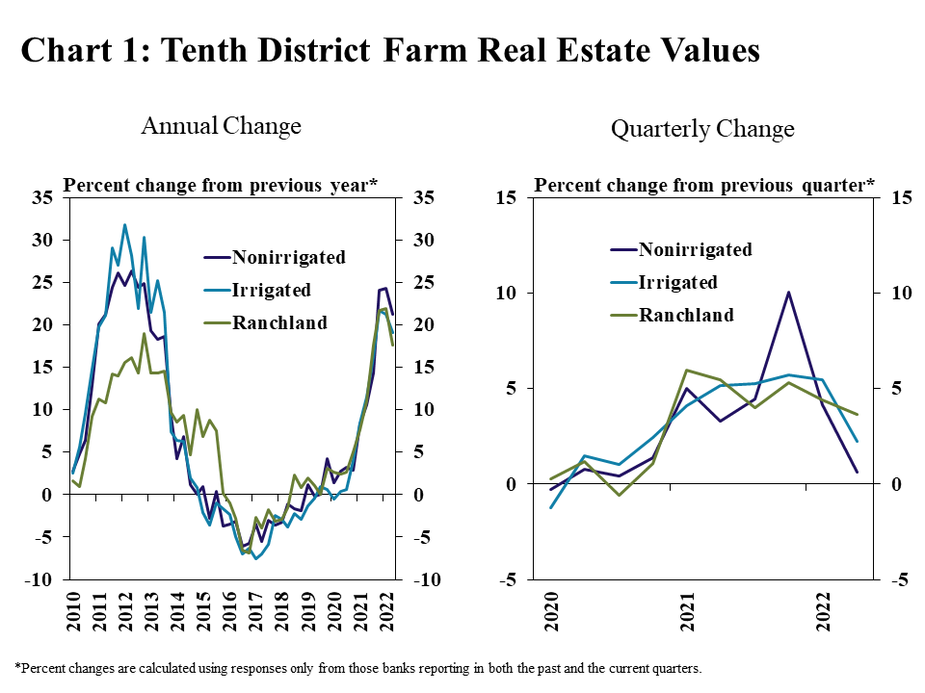
Farm real estate values continued to rise, but the pace of growth slowed in the second quarter. The value of all types of farmland in the region increased around 20% from a year ago, a slightly slower pace than prior quarters (Chart 1, left panel). Values increased by an average of about 2% from the previous quarter, which was the slowest increase for cropland since the end of 2020 (Chart 1, right panel). The pace of increase in ranchland values also slowed somewhat but remained slightly more stable at almost 4% quarterly growth.
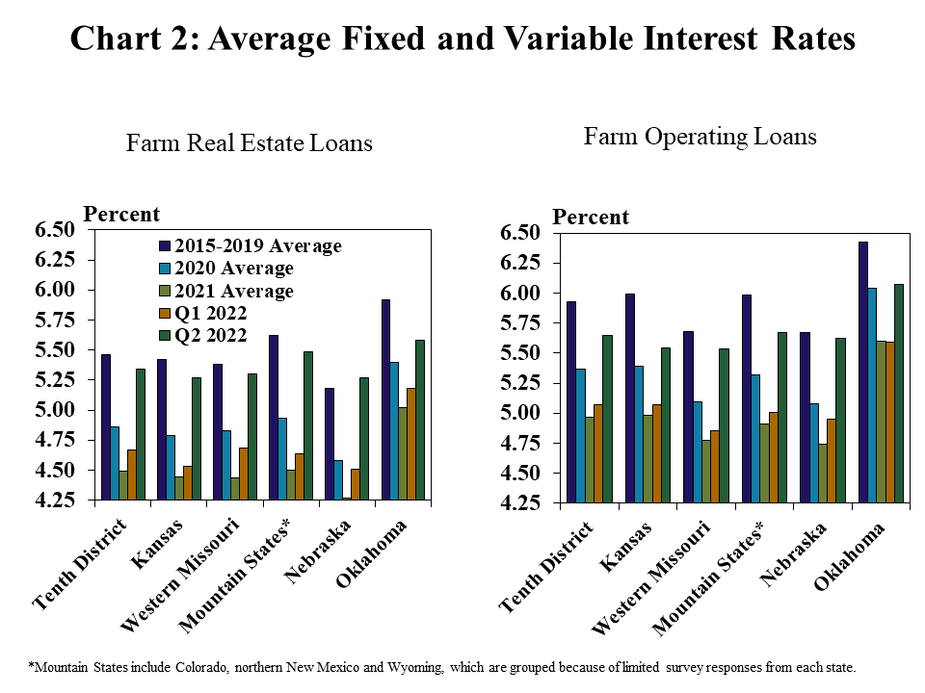
The slower increase in land valuations followed an uptick in farm loan interest rates. Throughout the District, the average rate charged on farm real estate and production loans increased by about 70 and 60 basis points, respectively, from the last quarter (Chart 2). Interest rates on operating loans remained about 30 basis points below the average from 2015-2019 while rates on real estate loans rose to within 10 basis points of that same period. The increase in the cost of farm real estate loans was most pronounced in Nebraska, where the average rate was slightly more than the 2015-2019 average.
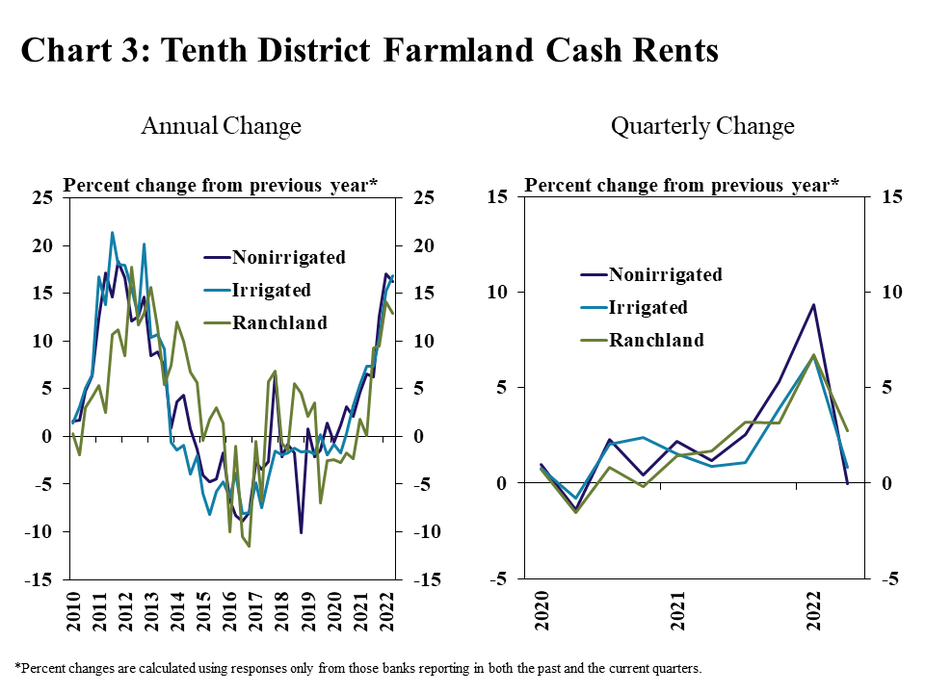
Similar to land values, the acceleration in cash rents also showed signs of slowing. Cash rents on all types of farmland in the region increased by an average of about 15% from a year ago, which was similar to the previous quarter and followed nearly a year of accelerating gains (Chart 3, left panel). Rents increased by an average of about 1% from the previous quarter, the slowest increase since early 2021 (Chart 3, right panel).
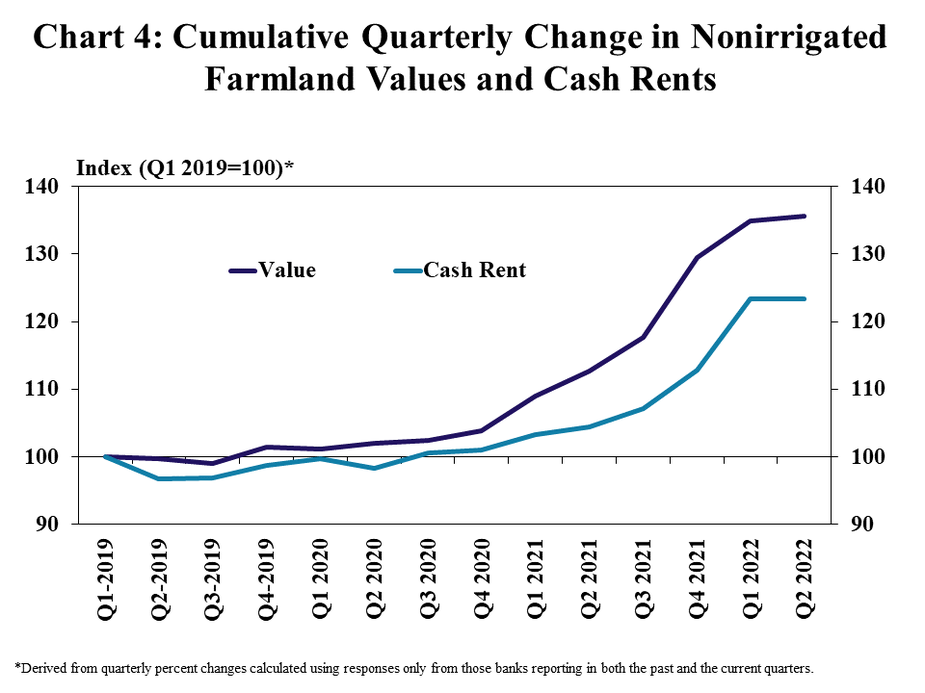
The growth in nonirrigated land values continued to outpace the rise in cash rents as both steadied from rapid gains in recent quarters. Nonirrigated farmland values have increased about 35% since the beginning of 2019, an average of nearly 3% per quarter (Chart 4). Cash rental rates grew about 25% over that period, an average of about 2% per quarter.
Section 2: Farm Income and Credit Conditions
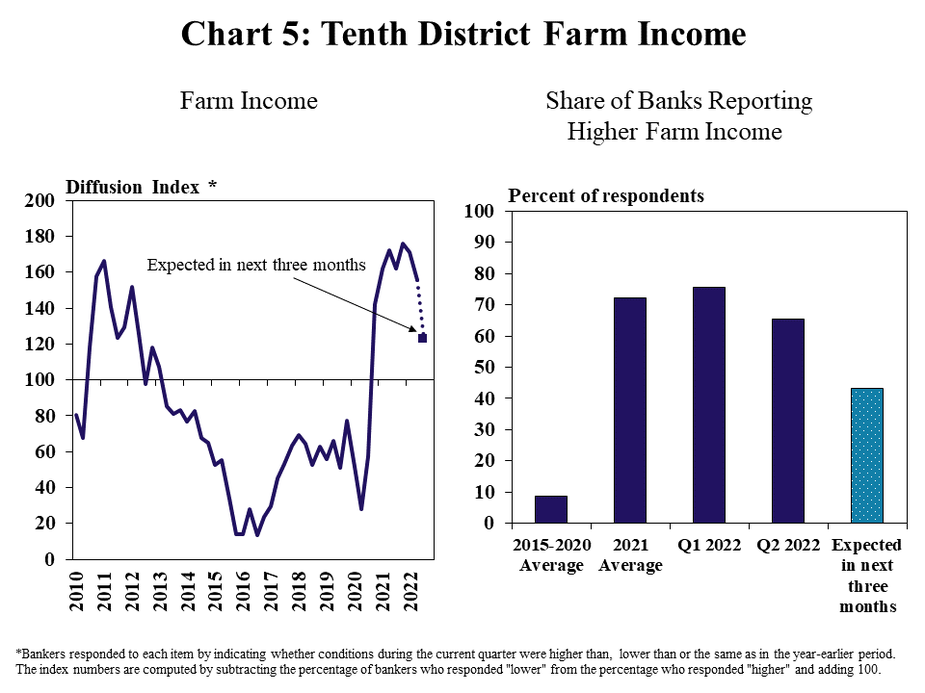
Farm finances across the District remained strong alongside elevated commodity prices, but the pace of increase softened. Farm income continued to improve overall, but the share of banks reporting higher incomes than a year ago dropped slightly (Chart 5). Expectations about the coming months were notably less optimistic, with fewer than half of all respondents anticipating higher farm incomes.
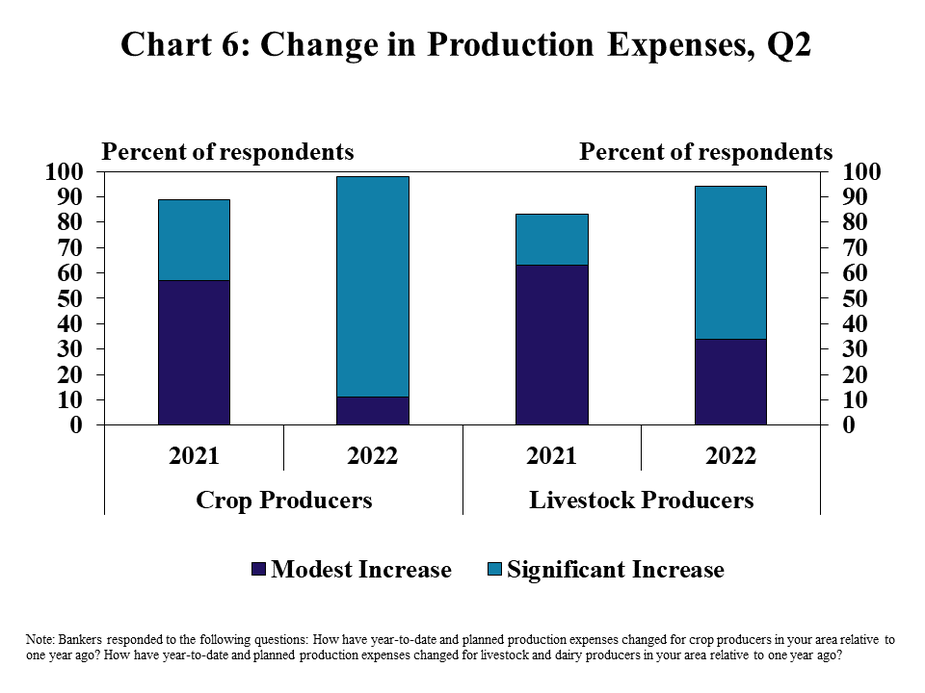
The softer outlook for farm income has followed a notable increase in production expenses. The share of banks reporting an increase in expenses for producers was similar to a year ago, but far more respondents indicated the rise in costs was more substantial (Chart 6). Nearly 90% and 60% of respondents noticed a significant increase in input costs for crop and livestock producers, respectively; triple the share that reported significant increases a year ago.
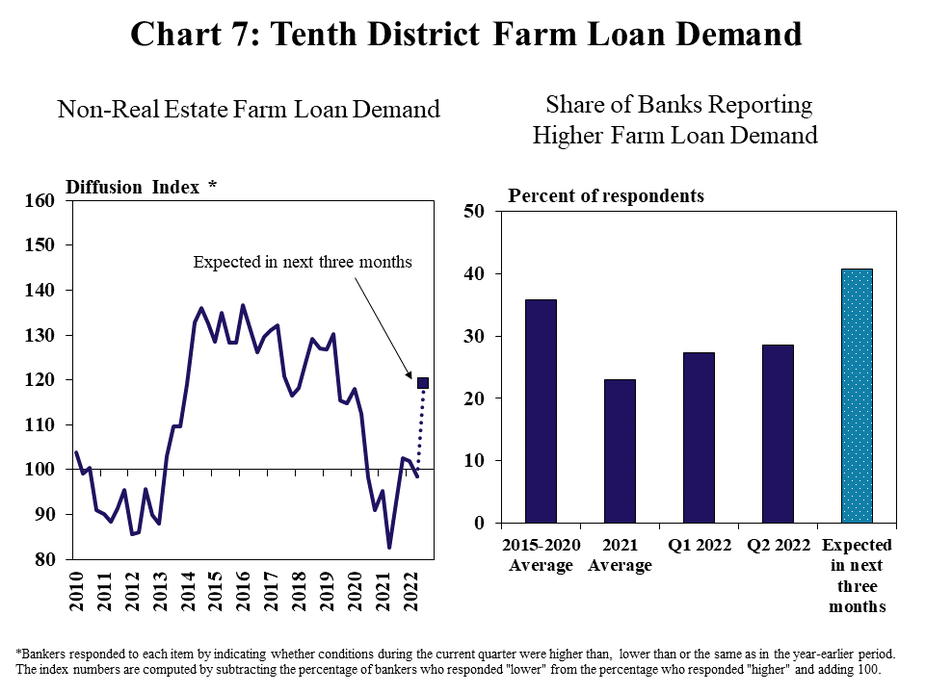
A rebound in loan demand was expected in the coming months alongside higher costs. Demand for non-real estate farm loans was nearly unchanged during the second quarter but was expected to grow in the next three months (Chart 7). About 30% of banks reported an increase in loan demand compared with a year ago during the first half of 2022, but 40% expected demand to be higher in the coming months.
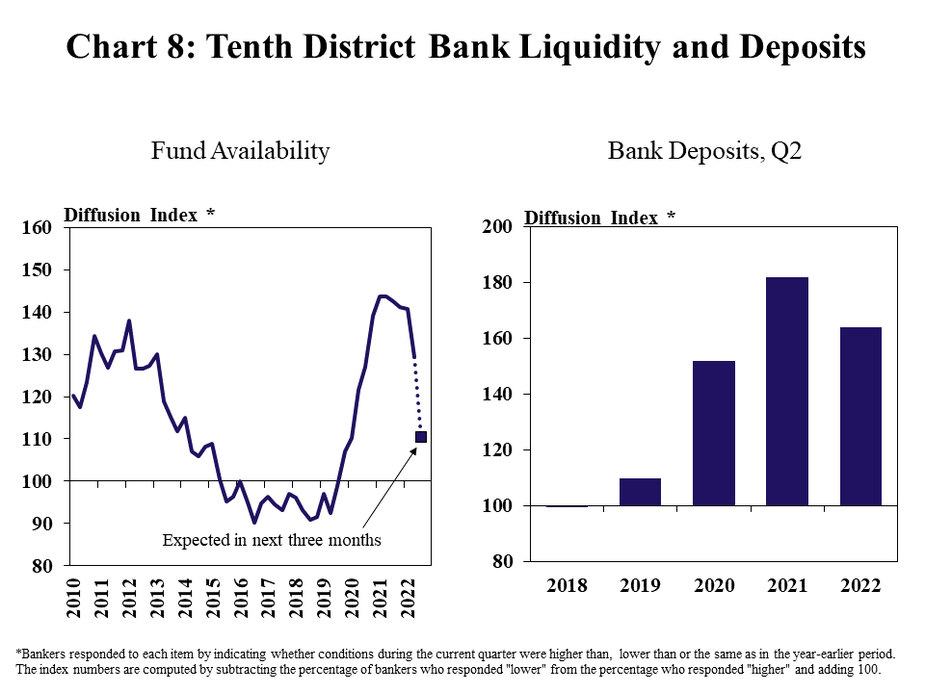
Ample deposit balances continued to support liquidity, and banks remained well positioned to meet growth in credit needs. For the third consecutive year, more than two thirds of banks reported an increase in deposits compared with a year ago (Chart 8). The glut of deposits drove further increases in availability of funds, but banks expected growth to slow in the coming months alongside the anticipated rebound in loan demand.
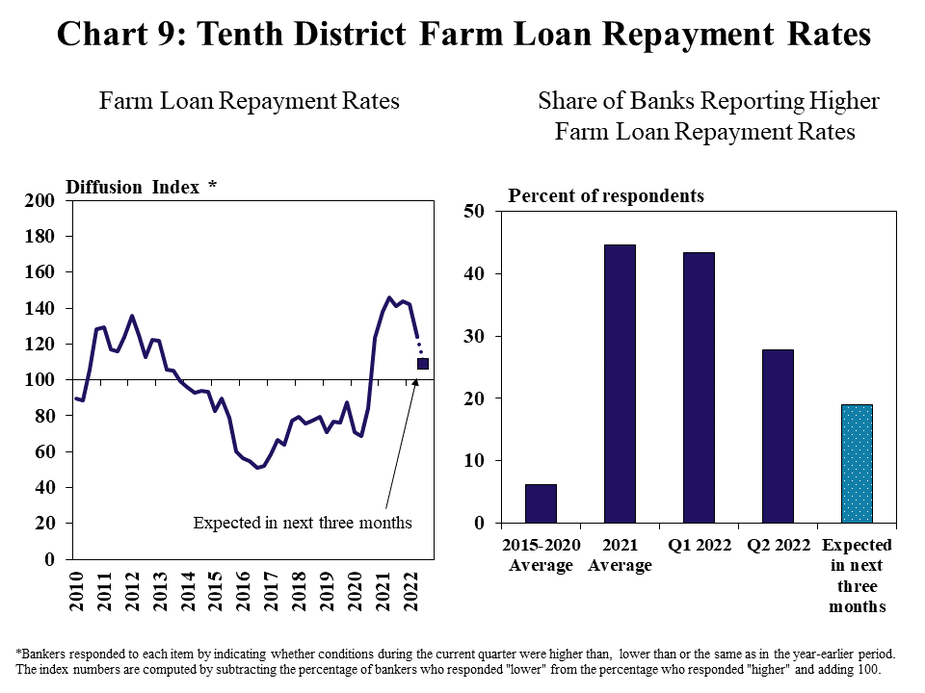
Strength in farm finances provided ongoing support to credit conditions, but improvement lessened in the second quarter. Farm loan repayment rates continued to increase, but at a slightly slower pace than in recent quarters (Chart 9). The share of banks with higher repayment rates than a year ago was about 30% less than last quarter and half as many expected repayment rates to continue growing in the next three months.
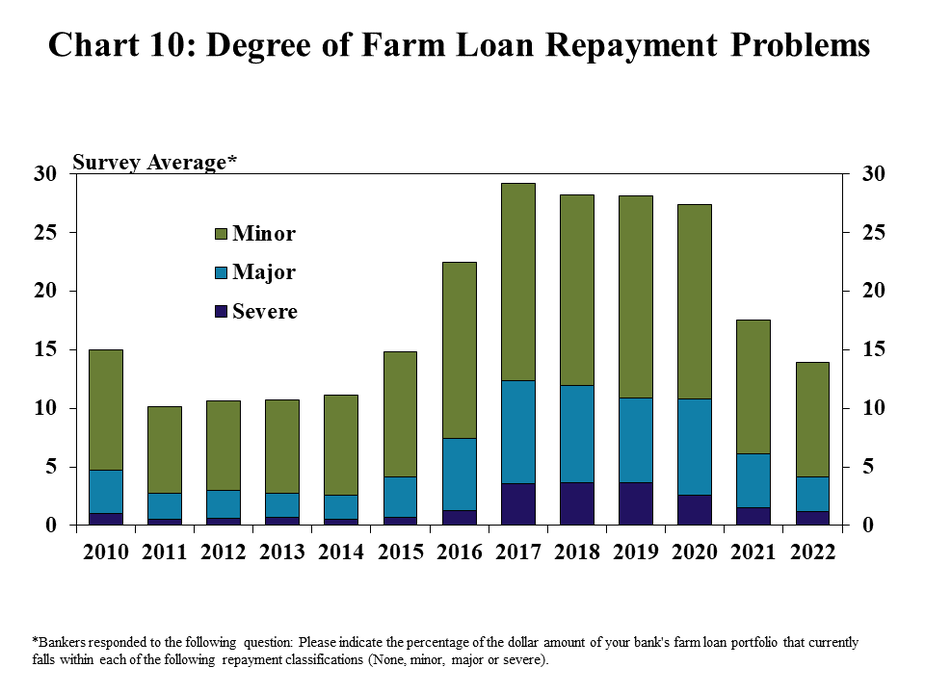
Despite a slower increase in loan repayment rates, loan performance continued to improve. Less than 15% of loan balances in the region had repayment issues, on average, and the majority of problems were minor (Chart 10). The prevalence of payment troubles dropped slightly from a year ago and reached the lowest level since 2014.
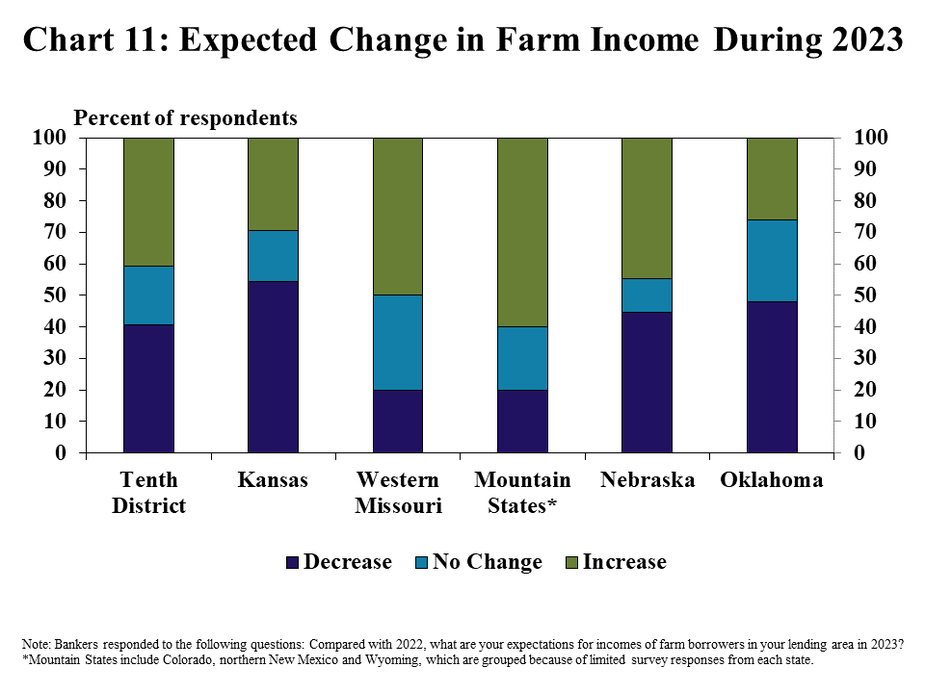
While credit conditions remained sound alongside strong farm finances, many bankers expected higher production costs to weigh on profits in the year ahead. About 40% of respondents throughout the District expected farm incomes in 2023 to be higher than in 2022, but 40% also expected incomes to be lower (Chart 11). Expectations were most optimistic in Missouri and the Mountain States and least optimistic in Kansas and Oklahoma.
Second Quarter 2022 Banker Comments from the Tenth District
“With the high costs of fuel, hay, chemicals, fertilizer and higher interest rates, profit margins will be even lower.” – Northern Colorado
“Hay prices are high and will increase with drought. The increases in pricing on commodities may not have much of an affect given the increase in inputs and higher interest rates could also have a big impact.”– Northern Wyoming
“Overall expenses for farm and ranch operations are significantly higher than a year ago. Income is not keeping pace, or even close, to the increase in operating expenses.”– Southeast Oklahoma
“High inputs will cause real problems if grain prices start to drop.”– Western Oklahoma
“The combination of drought, higher input costs, and higher fuel are expected to have adverse effects on livestock & crop producers alike. The unseasonably high temps and heat are burning up the hay crop and fields are yielding 30-40% less than they were a year.”– Northeast Oklahoma
“We have severe drought in good chunk of our trade territory and input costs and fuel are at record highs. Wheat harvest was less than average and the grass needs rain or cattle will have to be sold early.”– Western Kansas
“2020, 2021 and 2022 have been exceptionally strong for farm income and farm asset values and the excess liquidity in the farm sector has made it difficult to determine adequate farm values and measure profitability metrics.”– Northeast Kansas
“Inflation is a wild card that is driving inputs higher in all segments of agriculture and supply channels are unreliable. Good managers will have modest profit if current commodity prices hold through the fall harvest, but significant pain will be experienced by 50% or more of our producers if prices fall off even slightly.”– Northwest Missouri
“Operating Cost have increased; commodity prices have softened somewhat; dry weather has moved in and is beginning to impact expectations.”– Central Missouri
“Ag producers in our area should be able to squeeze out a profit in 2022 with the strong commodity prices, but everyone is far more nervous about 2023 and beyond.”– Northeast Nebraska
“The emerging issues at present are lack of sufficient moisture, increased fertilizer, chemical, and fuel costs, and rising interest rates.”– Southwest Nebraska
Data Files: Excel SpreadsheetCredit Conditions | Excel SpreadsheetFixed Interest Rates | Excel SpreadsheetVariable Interest Rates | Excel SpreadsheetLand Values
A total of 130 banks responded to the Second Quarter Survey of Agricultural Credit Conditions in the Tenth Federal Reserve District—an area that includes Colorado, Kansas, Nebraska, Oklahoma, Wyoming, the northern half of New Mexico and the western third of Missouri. Please refer questions to Cortney Cowley, economist or Ty Kreitman, assistant economist at 1-800-333-1040.
The views expressed in this article are those of the authors and do not necessarily reflect the views of the Federal Reserve Bank of Kansas City or the Federal Reserve System.