Excel SpreadsheetCredit Conditions | Excel SpreadsheetFixed Interest Rates | Excel SpreadsheetVariable Interest Rates | Excel SpreadsheetLand Values
Agricultural credit conditions in the Tenth District continued to strengthen in the first quarter of 2021. After a sharp rebound at the end of 2020, conditions in the broad agricultural economy continued to improve alongside additional increases in crop prices. Stronger profit potential for farm borrowers supported a second consecutive quarter of significant increases in farm income, loan repayment rates and farmland values.
Overall, farm borrowers in the District were in a better financial position than at the beginning of 2020, but the pace of improvement was notably slower for livestock producers and for producers in areas affected by severe drought. Cattle prices remained below pre-pandemic levels in the first quarter, and the scope and severity of drought was a major concern in western states. However, government programs continued to provide support amid these challenges and the prolonged buildup of financial pressure in recent years appears to have eased considerably.
Credit Conditions
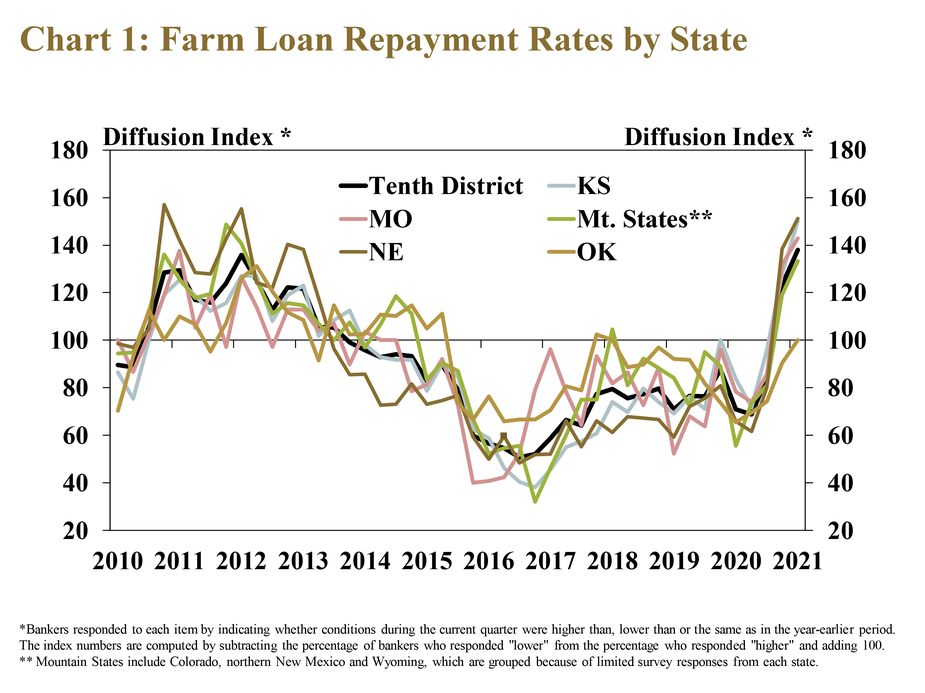
Repayment rates for farm loans in the first quarter improved significantly throughout the region. The rate of loan repayment increased rapidly for the second consecutive quarter in nearly all states (Chart 1). Following multiple years of weakness, 40% of all respondents reported an increase in repayment rates, the highest since 2012.
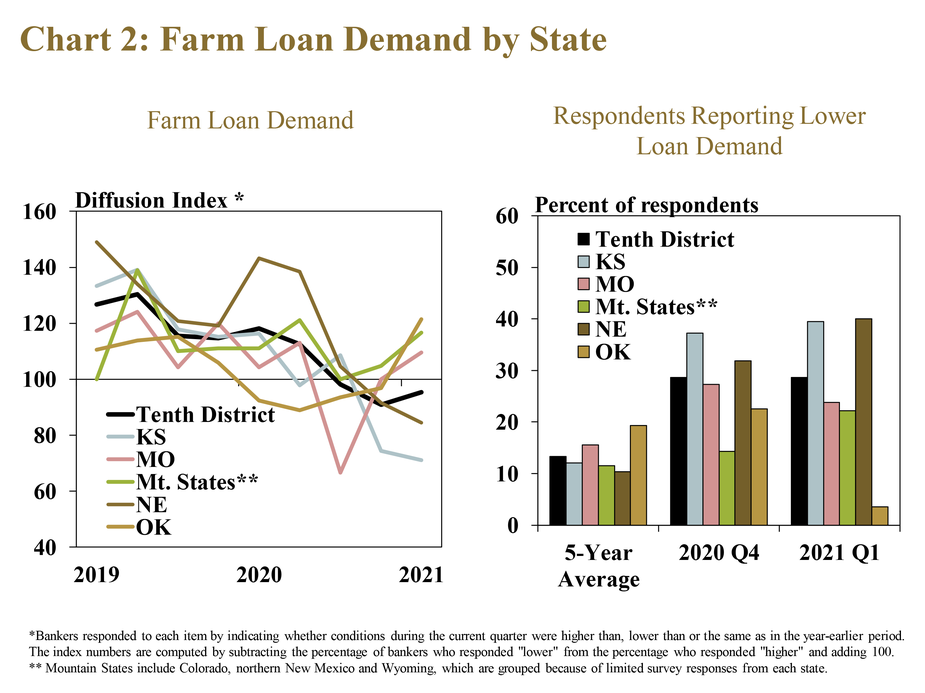
Loan demand, on average, was soft throughout the District, but varied across states. Bankers indicated demand decreased at a modest pace in Nebraska and Kansas and increased at a modest rate across all other states (Chart 2). Compared with the previous quarter, more respondents reported that loan demand had declined from a year ago in Nebraska and Kansas, but fewer lenders in Oklahoma and Missouri reported lower loan demand.
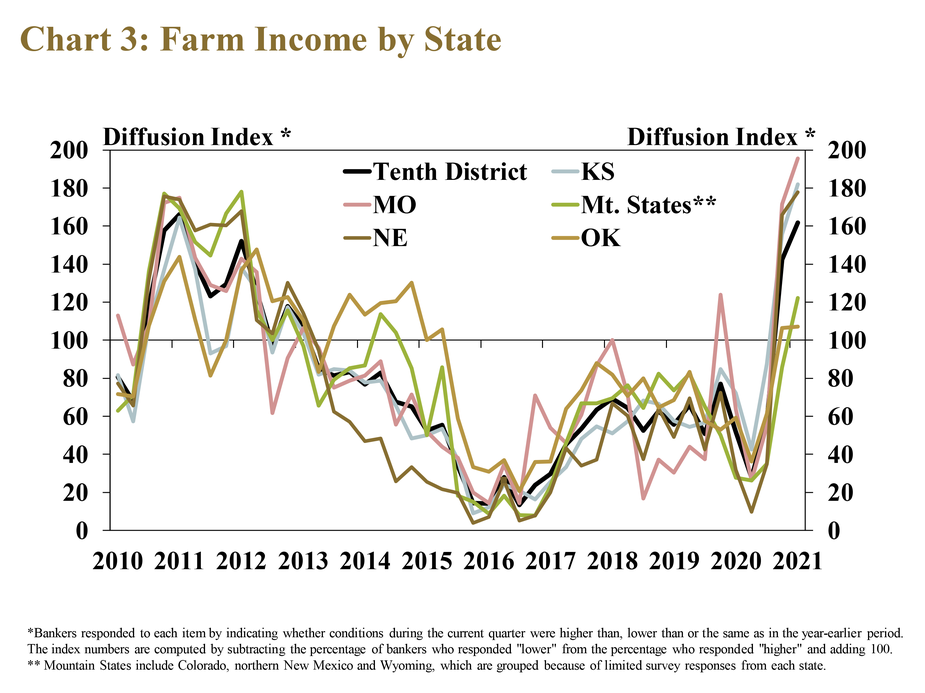
Farm income also strengthened, but at a slower pace in areas most concentrated in cattle production and exposed to intensifying drought. About two-thirds of all banks throughout the region reported that farm income was higher than a year ago, the largest share since 2011 (Chart 3). The share reporting an increase was 80% or more in Kansas, Missouri and Nebraska, but about 40% and 20%, respectively, in the Mountain States and Oklahoma.
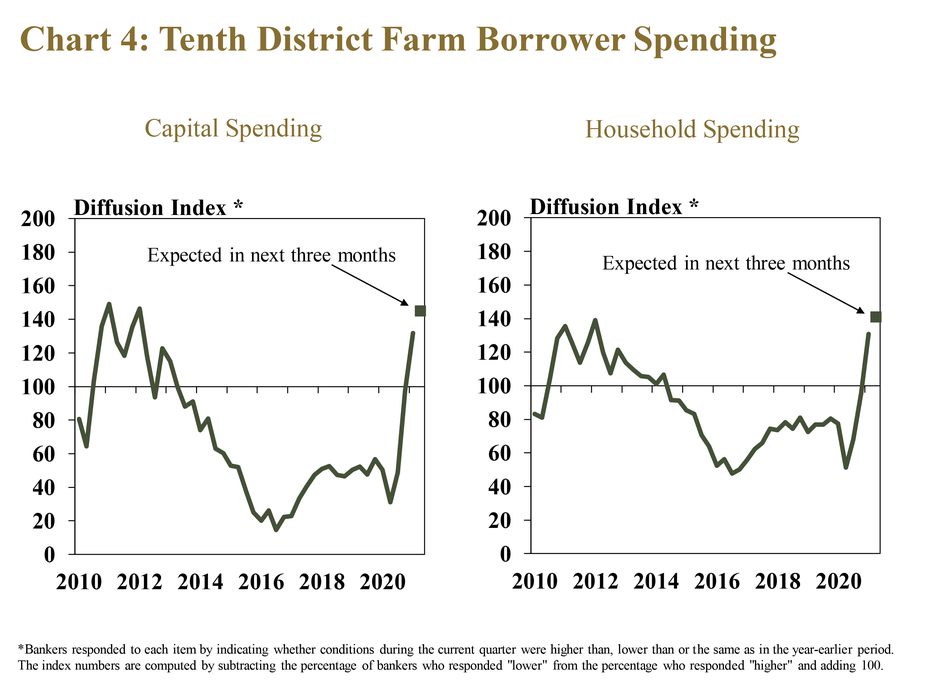
Alongside strength in farm income and credit conditions, borrower spending also rose at a rapid pace. Similar to farm income, the share of respondents reporting higher capital and household spending reached the highest level since 2012 (Chart 4). The first quarter survey marked the first time in eight years that both measures of spending increased in the same quarter, and the trend was expected to continue in the coming months.
Financial Condition of Farm Borrowers
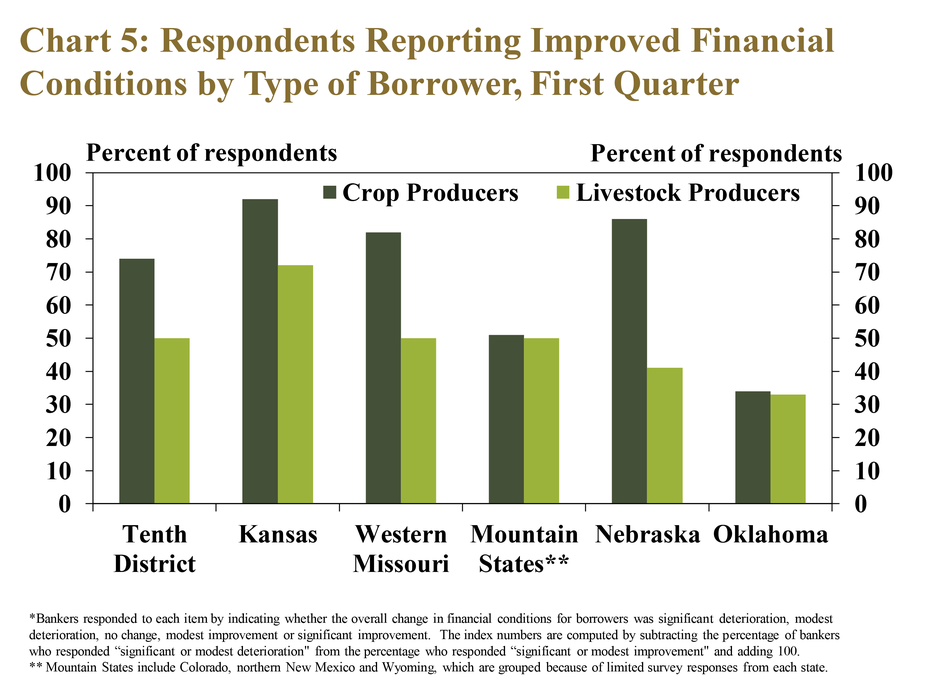
Financial conditions for farm borrowers improved at a majority of banks across the region, but less so for livestock producers and producers affected by drought. Nearly 75% of banks reported modest or significant improvement in conditions for crop producers relative to a year ago, but only half indicated that conditions for livestock producers had improved (Chart 5). Improvement was notably slower in Oklahoma and the Mountain States, where corn and soybeans account for a smaller share of farm revenues and where drought has been more severe and widespread.
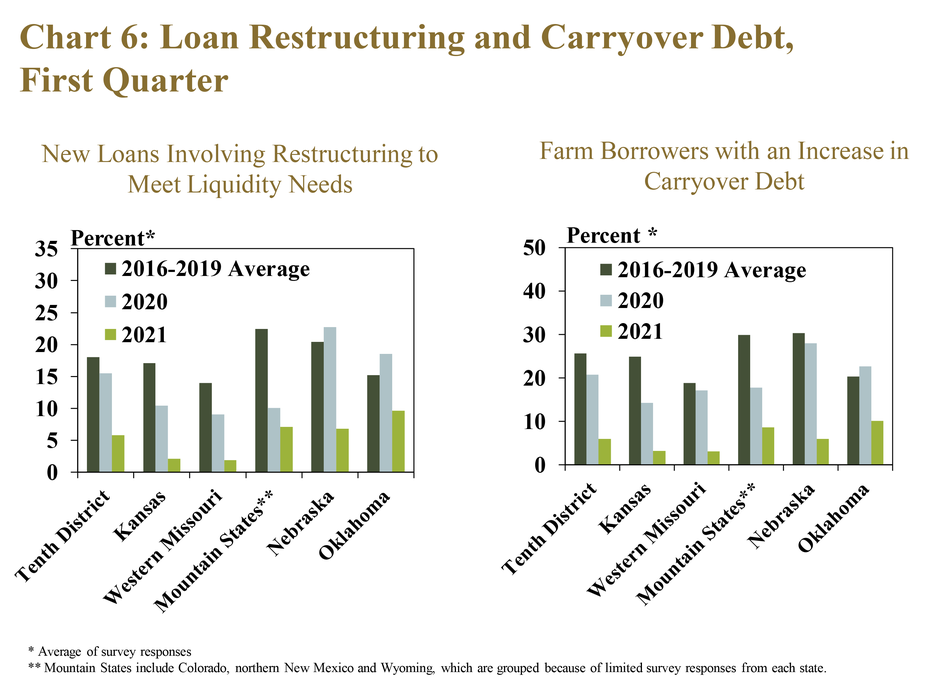
Better financial conditions also led to far less credit stress across the District. Instances of restructuring to meet liquidity needs and carryover debt declined substantially from recent years (Chart 6). The reprieve from mounting strain on borrowers generally was consistent across all states, but the shift was slightly less pronounced in Oklahoma and the Mountain States.
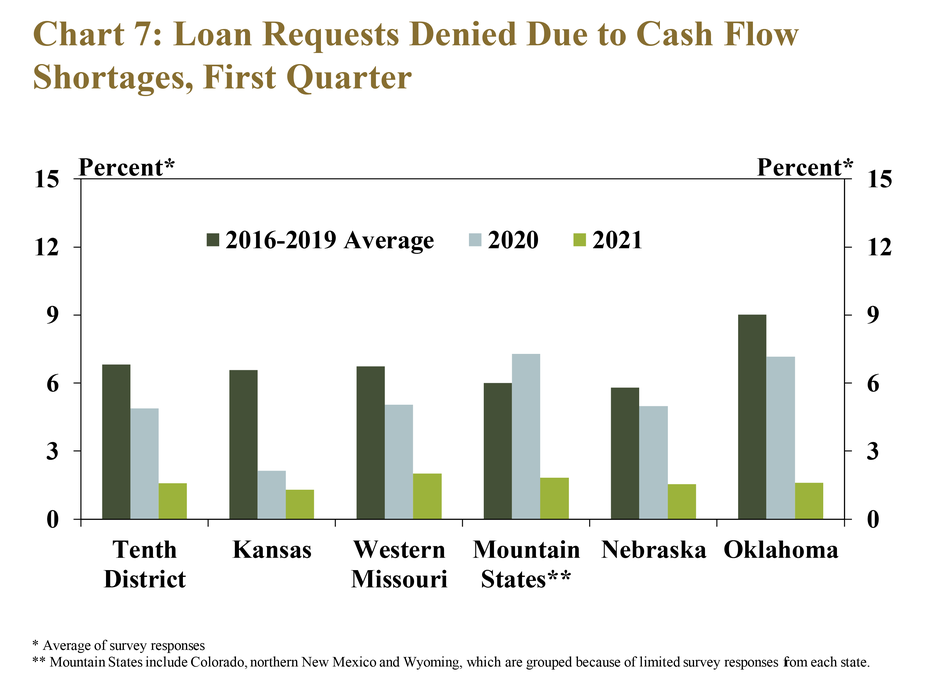
Similarly, lenders also denied a much smaller share of farm loans than previous years. In fact, less than 2% of loan requests were denied because of cash flow shortages at responding banks (Chart 7). The low level of denials on farm loan applications was consistent across all states in the region and was a stark contrast to the prior five years.
Farmland Values and Interest Rates
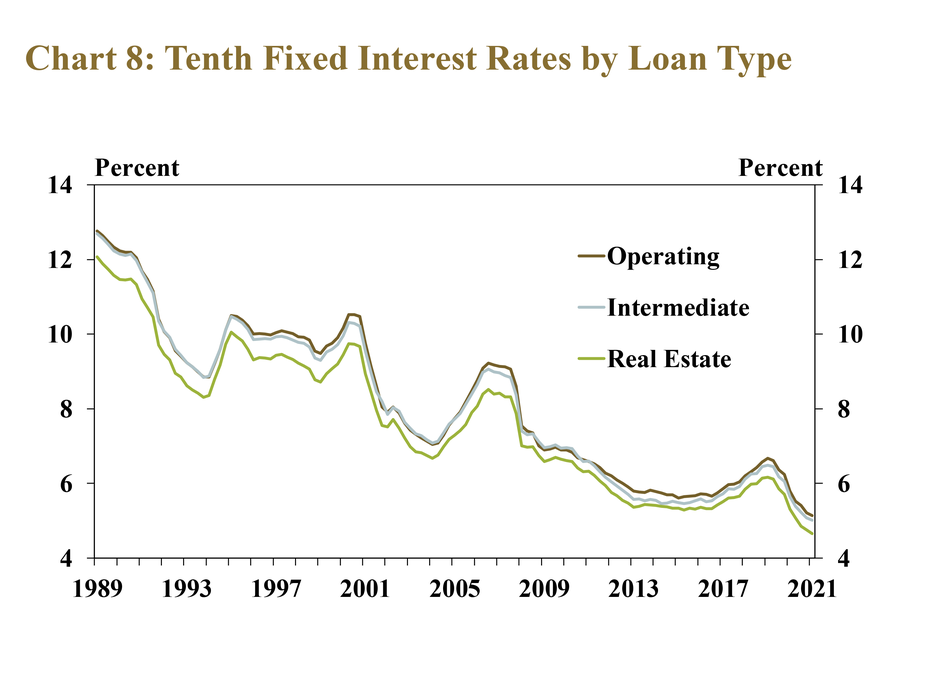
Providing additional support for farm finances, interest rates on farm loans fell further to historically low levels. After reaching near-term highs in the first quarter of 2019, interest rates on all types of farm loans have fallen 1.5 percentage points since then (Chart 8). For farm borrowers, reduced interest rates have lessened borrowing costs and likely have provided some support for asset values. However, for agricultural banks, low interest rates have put downward pressure on earnings.
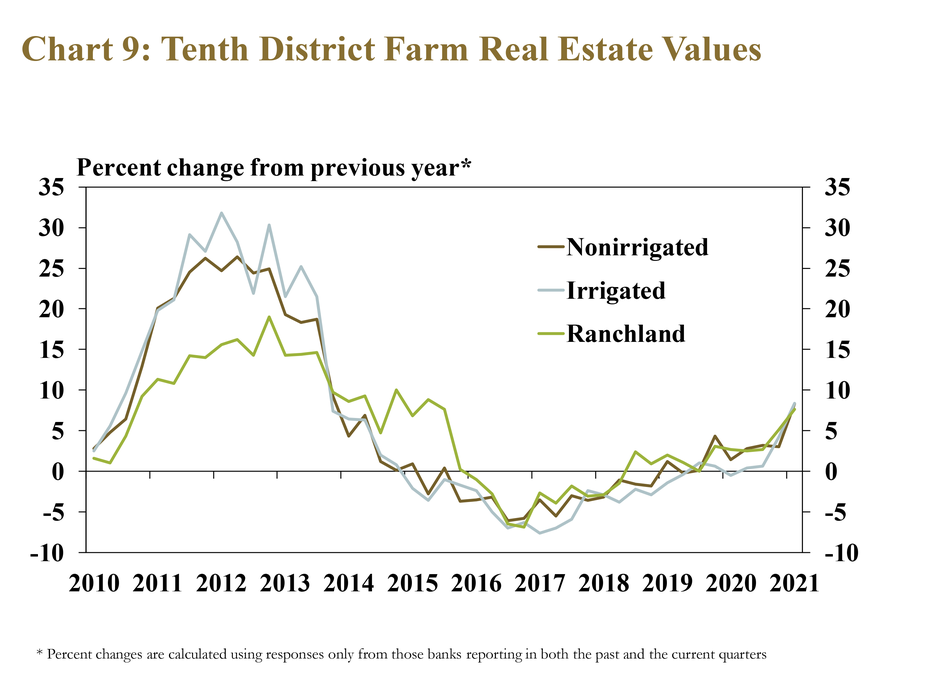
With support from a stronger farm economy and historically low interest rates, farm real estate values increased throughout the District. All types of farmland rose 8% in value in the first quarter (Chart 9). For cropland, this was the largest annual increase for the first quarter since 2013, while ranchland values rose at the fastest pace since 2015.
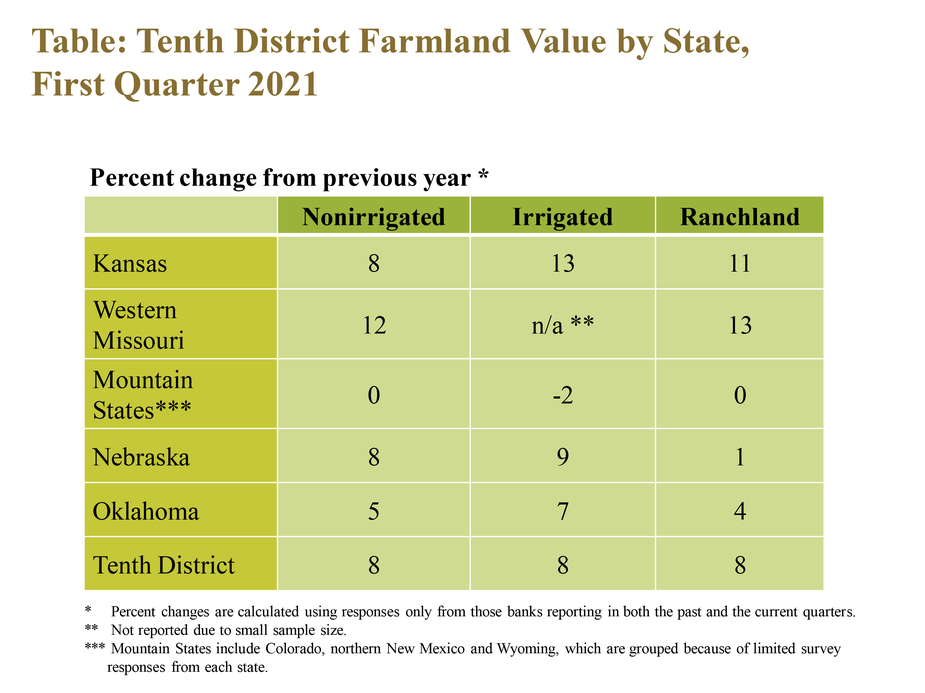
Farm real estate markets were especially strong in states less impacted by drought. Values for nonirrigated cropland rose at least 8% in Kansas, Missouri and Nebraska (Table). In contrast, cropland values remained unchanged in the Mountain States, where more than 70% of the land area was in severe to exceptional drought in the first quarter._
Banker Comments from the Tenth District
“Government payments and PPP made all of the difference in averting a deterioration of credit due to a combination of drought and disruptions from the pandemic.” – Southeast Colorado
“The increase in liquidity and improvement in financial conditions can primarily be attributed to steady prices along with the cash injection of PPP.” – Southern Colorado
“The drought monitor is showing expansion and our mild winter has raised some concerns as to how good our grass will be in pastures. The same holds true for dryland hay production as hay supplies are decreasing.” – Northern Wyoming
“The increase in input costs for both farmers and ranchers is going to be significant for 2021. Commodity futures prices are up for grains, but very little for cattle. The increase in the commodity prices may not offset the increase in input prices, but it appears that 2021 may be more volatile for farmers and ranchers than 2020.” – Northwest Oklahoma
“COVID payments have helped farmers in this area. Very few benefited from recent crop price increases, as most had sold or contracted grain previously.” – Northern Oklahoma
“It's a confusing time. Drought impacted a large area, however CFAP and various government program payments made a huge impact by year-end and the increased commodity prices have lifted spirits. Many producers have started selling commodities at very profitable levels, and most cash flows show a marked improvement.” – Southwest Kansas
“Stronger commodity prices, coupled with PPP loans and government stimulus payments have improved the economic condition for producers, particularly if they were able to store grain until 2021.” – Northeast Kansas
“There is a lot of cash floating around in the system. Loan demand appears to be reduced at nearly all banks and commodity prices saw some improvement, but expenses are increasing at a fast pace.” – Central Missouri
“My farm customers have taken advantage of the PPP loan program and it provided additional liquidity and funds for operating and debt reduction.” – Western Missouri
“Row crop farmers are flush with cash from profits and government payments on top of that, but ranchers are the entities that are still struggling.” – Central Nebraska
“Higher commodity prices plus the addition of CFAP payments, PPP loans and EIDL loans has made a significant improvement in financial conditions.” – Southeast Nebraska
Endnotes
-
1
More information on drought data, maps and classifications can be found at External Linkdroughtmonitor.unl.edu.
A total of 154 banks responded to the First Quarter Survey of Agricultural Credit Conditions in the Tenth Federal Reserve District—an area that includes Colorado, Kansas, Nebraska, Oklahoma, Wyoming, the northern half of New Mexico and the western third of Missouri. Please refer questions to Cortney Cowley, economist or Ty Kreitman, assistant economist at 1-800-333-1040.
The views expressed in this article are those of the authors and do not necessarily reflect the views of the Federal Reserve Bank of Kansas City or the Federal Reserve System.