Economic conditions have deteriorated sharply as a result of the COVID-19 pandemic and attempts to slow the spread of the disease through stay-at-home orders and social distancing. To help gauge how low-to-moderate income households have been affected, the Federal Reserve Bank of Kansas City conducted its Low-to-Moderate Income (LMI) Survey June 8-19. The survey collects information from nonprofits and other agencies that serve the LMI community in the states of the Federal Reserve’s Tenth District: Colorado, Kansas, western Missouri, Nebraska, northern New Mexico, Oklahoma and Wyoming. The overall assessment of conditions fell sharply in June. Relative to the prior year, the LMI Economic Conditions Index dropped to 45.5 from 87.3 (Chart 1). A reading below 100 indicates more respondents reported that conditions have worsened relative to the reference period (e.g., previous year). A lower index in the current versus prior survey means further deterioration in conditions. The index of conditions relative to the previous quarter and expectations for the quarter ahead also declined sharply – reaching levels not experienced since late 2011. The declines measured in June are among the largest in the history of the LMI survey, indicating how quickly conditions have worsened.
Chart 1: LMI Economic Conditions Index
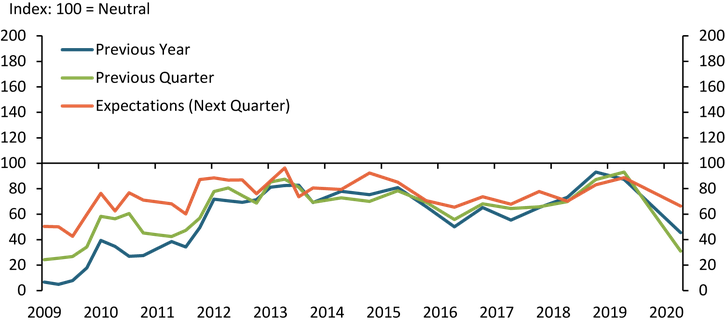
Source: Federal Reserve Bank of Kansas City LMI Survey.
Note: The survey asks respondents to assess conditions relative to the same period in the previous year, conditions relative to the previous quarter, and for their expectations for the following quarter relative to the current quarter.
The largest contributing factor to the decline in LMI conditions appears to job loss. Over the past several years, the job availability index was well above 100, indicating more and more jobs were available to LMI individuals (Chart 2). However, the job availability index relative to the previous year declined sharply from 135.4 to 38.7 in the June survey. Such a large decline is consistent with the record number of unemployment insurance filings in the broader economy starting in mid-March through mid-June, and the sharp rise in unemployment rates both regionally and nationally._ Expectations of job availability in the next quarter remained positive, likely reflecting the expectations of job losses being temporary or the ability to find other work.
Chart 2: LMI Job Availability Index
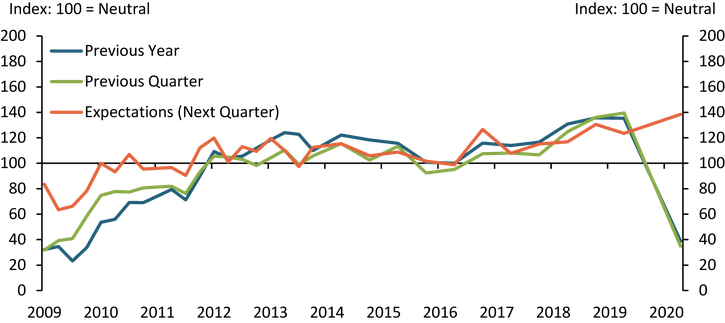
Source: Federal Reserve Bank of Kansas City LMI Survey.
Note: The survey asks respondents to assess conditions relative to the same period in the previous year, conditions relative to the previous quarter, and for their expectations for the following quarter relative to the current quarter.
In addition to the overall measure of economic conditions and the job availability index, the survey asks respondents about several other dimensions of economic health in LMI communities, which can be found in Appendix Table 1. The access to credit index remained well below 100, indicating that it became harder for LMI individuals to access credit, and like other indicators, diminished considerably compared with levels in previous surveys. Survey respondents cited tighter lending standards as a possible factor. The housing affordability index was little changed compared with previous surveys, and continued to suggest that housing is becoming less affordable. However, affordability expectations improved, likely indicating expectations of slowing increases in rental costs and housing prices.
Given the sharp deterioration in economic conditions, it was expected that demand for services from the LMI community would increase. However, demand for services actually declined slightly, as shown by the improvement in demand for services index (Appendix Table 1). While this may be counterintuitive, numerous contacts indicated that the pandemic unemployment benefits, stimulus payments and expanded food assistance put some LMI individuals in a better, albeit temporary, position. It is uncertain what relief future fiscal policy may offer. In general, increased services likely would require higher expenditures for many agencies. As a result, respondents to the June survey were asked about funding needs. A little over 60% of respondents indicated their organization had applied for relief grants or loans. Of those, nearly 75% were successful in securing funding.
Looking forward, respondents were asked to indicate how much time they expected would be necessary for activity at their organization to return to pre-COVID levels once restrictions are lifted. About 30% indicated it would take six to 12 months with another 33% indicating more than a year (Chart 3). Even though stay-at-home restrictions have been lifted in many states, the number of COVID cases as of late June is on the rise again._ As a result, the needs of the LMI community may remain elevated or increase more should restrictions to slow the spread of the virus be put back in place.
Chart 3: Expectations of Timing to Return to Pre-COVID Levels After Lifting Restrictions
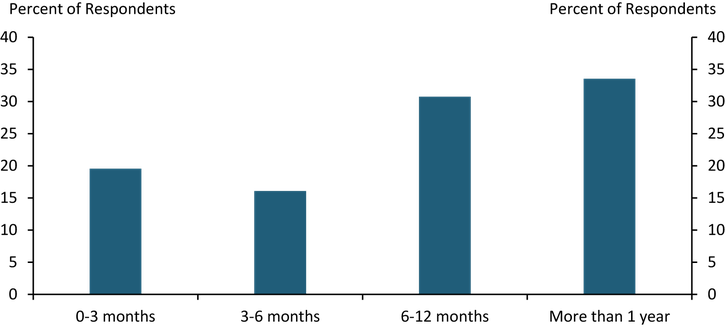
Source: Federal Reserve Bank of Kansas City LMI Survey.
Diffusion Indexes
Survey participants respond to each survey question by indicating whether conditions during the current quarter were higher (better) than, lower (worse) than or about the same as in the previous quarter or year. Providers also are asked what they expect conditions to be in the next quarter. Diffusion indexes are computed by subtracting the percentage of survey participants that responded lower (worse) from the percentage that responded higher (better) and adding 100. The exception is the LMI Demand for Services Index, which is computed by subtracting the percentage of survey participants that responded higher from the percentage that responded lower and adding 100 so that higher needs translate into lower numbers for the index. A reading less than 100 indicates the overall assessment of respondents (balance of opinion) is that conditions are worsening. For example, an increase in the index from 70 to 85 would indicate conditions are still deteriorating, by consensus, but that fewer respondents are reporting worsening conditions. Any value more than 100 indicates improving conditions, even if the index has fallen from the previous quarter or year. A value of 100 is neutral.
Appendix Table 1. Diffusion Indexes for Low- And Moderate-Income Survey Responses

Source: Federal Reserve Bank of Kansas City LMI Survey.
Notes: The diffusion indexes were computed from responses to the Federal Reserve Bank of Kansas City’s biannual LMI Survey, conducted in June 2020. The survey asks respondents about conditions relative to the previous quarter and year as well as expectations for the next quarter.