General Assessment
Indicators of economic and financial conditions in low- and moderate-income (LMI) communities suggest that recovery may have stalled over the last several months. Movement in economic indicators in the LMI Survey was mixed, but the LMI Financial Condition Index continued a sharp decline. Further, the LMI Affordable Housing Index maintained a downward trend that began in 2013. The indexes, which are diffusion indexes (see box), are computed from results of the Federal Reserve Bank of Kansas City’s biannual LMI Survey, which was administered in July 2016 (“July survey”) (the survey is biannual, but asks respondents about conditions in the previous quarter and year, as well as projections for the following quarter)._
LMI individuals (or families or households) are those with incomes less than 80 percent of area median income. For those in urban areas, area median income is the value for the metropolitan area; for those in rural areas, it is state median income.
Diffusion Indexes
Providers of services to the LMI population respond to each LMI Survey question by indicating whether conditions during the current quarter were “higher” (or “better”) than, “lower” (or “worse”) than, or the same as in the previous quarter (“quarterly index”) or year (“year-to-year index”). Additionally, providers are asked about what they expect conditions will be in the future quarter. Diffusion index numbers are computed by subtracting the percent of service providers that responded “lower” (or “worse”) from the percent of service providers that responded “higher” (or “better”) and adding 100. The exception is the LMI Services Needs Index, which is computed by subtracting the percent of service providers that responded “higher” from the percent of service providers that responded “lower” and adding 100 to show that higher needs translate into lower numbers for the index. Any number below 100 indicates the overall assessment of survey respondents is that conditions are worsening. For example, an increase in the index from 70 to 85 would indicate conditions are still deteriorating, by consensus, but that fewer respondents are reporting worsening conditions. Any value above 100 indicates improving conditions, even if the index has fallen from the previous quarter or year. A value of 100 is neutral.
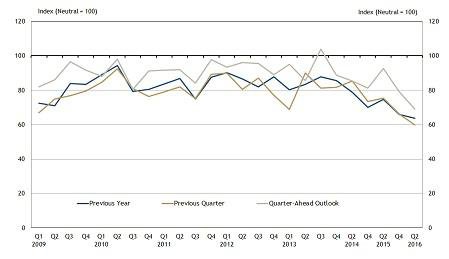
The LMI Financial Condition Index, the broadest assessment of economic conditions in the LMI community over the previous quarter, has dropped sharply in recent months (Chart 1). Following a decline from 78.3 to 69.2 in the January 2016 survey (“January survey”), the index fell further to 55.8 in the July survey, its lowest reading since late 2011. Almost half of respondents said LMI financial conditions were worse relative to last quarter._
Chart 1: LMI Financial Condition Index
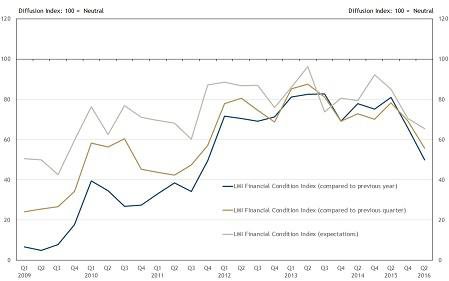
Notes: LMI Survey data were collected quarterly prior to 2014. For details on the computation of diffusion index values, see box inset in the text.
The Sample composition broadened with this survey, and therefore this quarter's results may not be directly comparable to those in the January survey.
(Source: Federal Reserve Bank of Kansas City LMI Survey)
Perceptions of economic conditions relative to one year ago also fell sharply from 65.9 to 50.0. Both indexes of financial conditions are well below the neutral reading of 100, indicating widespread perceptions of deterioration in economic conditions in the LMI community. While these indexes remain above the troughs of the recession, they have lost significant ground over the last year.
The magnitude of the decrease in contacts’ perceptions of overall economic conditions is surprising in light of the performance of most other indexes, which were relatively little changed. The sense from the survey’s open-ended comment section is that many of our survey respondents believe that observed improvement in the economy, broadly speaking, has not yet materialized in LMI communities. Job availability typically has been the most important driver of overall economic assessment, and it remains near neutral, but many contacts expressed concerns about low or stagnant wages. Further, other indexes, even if stable, remain well below neutral, suggesting that conditions are continuing to deteriorate. Expressions of concern about gender, racial and ethnic disparities were much more common in the July survey than in past surveys, even outside the special question (see below).
The Need for Social and Community Services
While the LMI Financial Condition Index has performed poorly in recent months, the LMI Services Needs Index has improved, although it remains far below neutral. This survey question is objective. It asks whether demand for the respondent organizations’ services has increased, decreased, or remained about the same. The year-over-year LMI Services Needs Index (demand relative to one year ago) increased from 40.9 in the January survey to 48.9 in the July survey, suggesting that fewer contacts have seen increased demand for their services (higher demand for services translates into lower numbers for LMI Services Needs Index). Still, less than 7 percent of respondents reported a decline in demand for their services, while 49 percent indicated demand had continued to increase. With a couple of exceptions, the services needs index has fallen consistently below 50 since the first LMI Survey in the first quarter of 2009. In the second quarter of 2009, at the height of the recession, the index was 12.1. The index of expectations for the next quarter also increased modestly in the July survey.
Although the LMI Services Needs Index is ticking upward, it is important to note that these diffusion indexes are rolling benchmarks. Whether conditions are getting better or worse depends on the value of the index relative to neutral (100). Moreover, even neutral does not necessarily imply conditions are “good,” only that they are not getting worse. Most of the external data we surveyed do not report increasing demand for social and community services, but they do continue to show historically high demand for social and community services.
Although food security is improving, it remains a problem in some areas. Participation in the Supplemental Nutrition Assistance Program (SNAP, formally food stamps) has declined moderately in recent quarters, but participation remains high. Indeed, June 2016 SNAP participation by both individuals and households was higher than at any time since the program started in 1969 until 2011 and was lower than its 2013 peak by only 4 percent._ In addition, area news organizations commonly report inadequate resources to address nutritional needs._
Requests for utility assistance have persisted at high levels, particularly for power and water. For example, in the most recent quarter, the Greater Kansas City United Way’s 211 help line received 8,739 calls for power or water service payment assistance._ While requests were down from 9,734 in the same quarter of 2015, the percentage of callers unable to be served increased from 6.5 percent to 7.1 percent.
Chart 2 shows the LMI Services Needs and LMI Organization Funding diffusion indexes from the LMI Survey. As noted above, the LMI Services Needs Index has remained well below neutral, indicating persistent increases over time in the demand for services. The LMI Organization Funding Index, which assesses whether funding has been higher, lower, or about the same, generally has fallen below neutral amid an increase in the demand for services. Further, the funding index in the last two years has been trending down. Finally, the chart also shows that funding for utility assistance from the Low Income Home Energy Assistance Program (LIHEAP), has been declining since 2011._ For LIHEAP, the blue line in Chart 2 is constructed differently than for the diffusion indexes. The index is assigned a value of 100 in 2010, and the other values are funding levels relative to the first quarter of 2010. The latest available data from LIHEAP show funding in 2015 was down about 27 percent from 2011._
Chart 2: Funding in the 10th District Compared to the Quarterly Service Needs Index
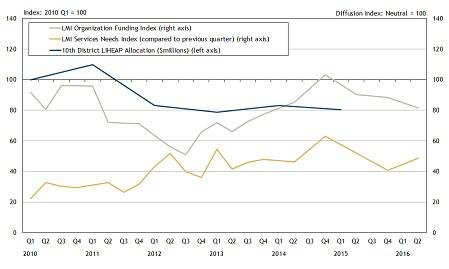
The Sample composition broadened with this survey, and therefore this quarter's results may not be directly comparable to those in the January survey.
(Sources: Kansas City Fed LMI Survey; Low Income Home Energy Assistance Program)
Survey responses suggest slowdowns in the energy sector may have caused a greater influx of applicants to social programs in affected areas. Respondents in energy-intensive states were more likely to express concerns about social and community services than those in other states. Economies in specific states—or areas within states—often reflect ups and downs in their key industries. Booms and busts in any sector, much less in economic activity as a whole, may have significant indirect spillover effects as well, like reducing the demand for local services. Diminished demand for local services would be expected to disproportionately affect LMI workers, who often work in the leisure and hospitality industry or in other low-paying service sectors._
Labor Market
Job Availability
Perceptions of job availability relative to the previous quarter and previous year declined significantly in the January survey, moving the index from an overall assessment of increasing job availability to one of neutrality. The LMI Job Availability Index remained near neutral in the July survey (Chart 3). Unemployment and other general measures of labor market conditions have improved significantly in most sectors of the economy, and the neutral assessment in the job availability index may reflect, at least in part, a stabilization of job growth. The Kansas City Fed’s Labor Market Conditions Index also has flattened recently._
Chart 3: LMI Job Availability Index
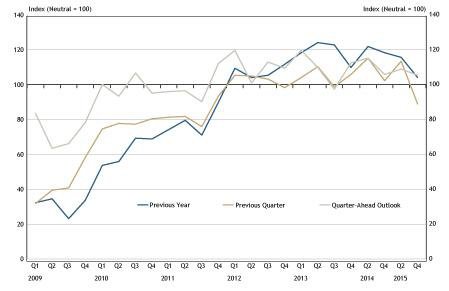
Notes: LMI Survey data were collected quarterly prior to 2014. For details on the computation of diffusion index values, see box inset in the text.
The Sample composition broadened with this survey, and therefore this quarter's results may not be directly comparable to those in the January survey.
(Source: Federal Reserve Bank of Kansas City LMI Survey)
LMI Survey respondents noted that natural disasters, local government and charitable funding conditions, and industry slowdowns affected local employment. Local labor markets can differ substantially because of unique attributes or events. In addition, states, and especially localities, may have very different industrial structures, which may make them more or less susceptible to slowdowns in specific sectors.
Unemployment Rate
The official U.S. unemployment rate (U-3), which is defined as the share of the labor force that is not currently working but actively seeking employment in the last four weeks, was 4.9 percent in August, and the Tenth District unemployment rate was 4.6 percent (both seasonally adjusted)._ By comparison, the August 2015 national and District unemployment rates were 5.1 percent and 4.1 percent, respectively.
The BLS reports a number of alternative unemployment rates._ U-6 is the broadest measure of the unemployment rate. It is the sum of the official unemployment rate (U-3), the share of the labor force that is part time for economic reasons (would like a full-time job), and the share of the labor force that is discouraged or otherwise marginally attached to the labor force. Discouraged workers (discussed in more detail below) would like a job but believe a continued search for work would be futile. Other forms of marginal attachment would include, for example, temporarily halting a job search to gain a new skill. The key is that the individual has looked for work in the last 12 months but not in the past four weeks and wants a job. The national U-6 unemployment rate for August 2016 was 9.7 percent, down from 10.4 percent in August 2015._
LMI Breakdown of the Unemployment Rate
Unemployment rates by income groups are not reported in government statistics, and disentangling unemployment and income is difficult. For example, an unemployed worker is likely to have little or no income, and those in low-income families are more likely to be unemployed._ Unemployed workers may receive unemployment insurance (UI) compensation, but LMI workers are less likely to qualify, largely because of eligibility rules for part-time workers._ Further, UI typically is available for a maximum of 26 weeks._
While unemployment among LMI workers cannot be directly identified, other statistics about LMI worker characteristics such as educational attainment offer some insights. Unemployment is highly correlated with educational attainment, and LMI workers typically are less educated than other workers._ The latest data show a 2.9 percent unemployment rate for those with a bachelor’s degree, compared to 4.7 percent for those with a high school diploma, but no college._ The unemployment rate for those who had not completed high school was 7.7 percent.
Duration of Unemployment
A significant labor market problem during the recession and recovery has been the rate of long-term unemployment, which is the share of unemployed who have been out of work for more than 26 weeks. From the post-World War II era to the 2007 recession, the long-term unemployed share of total unemployment topped 25 percent only in June 1983 (Chart 4). Although recessions typically are associated with much higher shares of long-term unemployment, typically they have peaked between 20 percent and 25 percent. However, the share of the unemployed that is long-term has exceeded 25 percent since April 2009, peaking at 45.5 percent in April 2010.
Chart 4: Historical Trend in Long-Term Unemployment
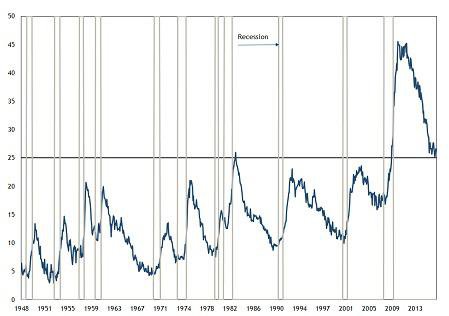
Note: The values shown are the share of unemployed that has been unemployed for more than 26 weeks
(Sources: U.S. Bureau of Labor Statistics; Haver Analytics; National Bureau of Economic Research)
The August 2016 long-term unemployed share of total unemployment was 26.1 percent. The share has declined sharply since its peak but remains high by historical standards. In non-recession years between 1970 and 2007, the share of long-term unemployment averaged 10.3 percent of total unemployment.
The financial effects of unemployment often are more dire for the long-term unemployed than the short-term unemployed. The long-term unemployed are more likely to have reached limits on state or federal unemployment insurance compensation or to have had extended benefits nullified because of improvements in local labor market conditions. Indeed, as noted above, unemployed LMI workers are less likely to qualify for unemployment insurance compensation. Further, LMI workers are much more likely to have exhausted personal resources such as precautionary savings, retirement accounts and lines of credit. A large majority of LMI families have no access to precautionary or retirement savings and very limited access to traditional credit._
Finally, the long-term unemployed often find it more difficult to secure a new job. Over time, skills may atrophy or become obsolete. Employers recognize this potential, which may make them more reluctant to hire the long-term unemployed. Further, they also may perceive the length of unemployment to be indicative of poor worker quality (because other employers have not wanted to hire them).
Labor Force Participation
The labor force participation rate (LFPR) is the share of the population eligible to work (noninstitutionalized population 16 years and older) that is employed or not employed but actively seeking employment (searched in the last four weeks). In August 2016, the national LFPR was 62.8 percent, significantly lower than the LFPR of 66.2 percent just prior to the 2007 recession.
For the majority of people not in the labor force, the decision is by choice. Currently, over 93 percent of those not in the labor force “do not want a job,” a significant portion of whom are voluntarily retired. But for others, lack of labor force participation is not entirely “voluntary.” Included are “discouraged workers” and other “marginally attached” workers, defined above. In August 2016, there were about 576,000 discouraged workers, accounting for 0.6 percent of work-eligible individuals not in the labor force. Another 1.2 percent was otherwise marginally attached to the workforce.
The LFPR has a secular trend that can be identified using statistical modeling._ Movements in the trend have mostly resulted from demographic factors. From the mid-1960s until the late 1990s, the LFPR trended upward as baby boomers entered working age and women increasingly entered the labor force. The secular trend leveled off before starting to decline as baby boomers reached retirement and life expectancies increased. The latter reduces the LFPR because participation becomes much lower at advanced ages.
Chart 5 shows the estimated secular trend and the actual LFPR. The secular LFPR trend was computed using a statistical model, assuming that movement in the LFPR is driven by a long-term trend, largely demographic factors, and a transitory component._ Specifically, the secular trend is identified from the long-run estimates of the LFPR generated by the model, while the transitory component is the deviation of the actual LFPR from the trend. The difference between the realized LFPR (blue line) and the secular trend (tan line) is due to cyclical factors, such as recessions.
Before the 2007 recession, the LFPR was only weakly pro-cyclical compared to its secular trend (it was modestly higher during booms and modestly lower during recessions). After 2009, the cyclicality strengthened, meaning LFPR became significantly more sensitive to economic conditions. Indeed, the decline in LFPR was much faster than would have been predicted by the secular trend, with cyclical factors accounting for an unprecedented 50 percent of the decline._ In recent years, the relationship between cyclical factors and observed LFPR has weakened but has far from disappeared.
Chart 5: Trends in the Labor Force Participation Rate
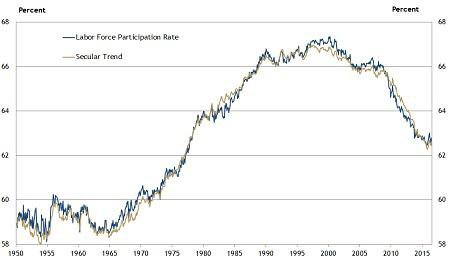
Note: The secular LFPR trend data were computed using a vector autoregression (VAR), assuming that movement in the LFPR is driven by a long-term trend and a transitory component. Specifically, the secular trend is identified from the long-run forecast of the LFPR generated by the model, while the transitory component is the deviation of the actual LFPR from the trend. Details can be found in Willem Van Zandweghe, “Interpreting the Recent Decline in Labor Force Participation,” Economic Review, Federal Reserve Bank of Kansas City, 2012, vol. 97, no. 1, pp. 5-34.
(Source: Federal Reserve Bank of Kansas City)
A significant portion of the cyclical decline arose from workers dropping out of the labor force for economic reasons such as discouragement with a job search. This phenomenon means the unemployment rate rose more slowly than would have otherwise have been the case. Theoretically, the unemployment rate could fall simply because workers moved from unemployment to “not in labor force.” As the economy improves and workers reenter the labor force, the unemployment rate would be expected to decline more slowly than it would otherwise.
Underemployment
Challenges to the LMI labor market extend beyond unemployment to “underemployment,” typically defined as an insufficient amount of work, but often more broadly defined to include those working in an occupation that requires education, training and/or experience below those attained by the worker.
Among the employed, millions are part-time workers who would prefer a full-time job. Part-time employment is defined by the BLS as less than 35 hours per week. Most workers who are employed part time have sought part-time work intentionally. They may want to work only part time to devote more time to family or other pursuits, or they simply may be uninterested in working full time. Some are part time for economic reasons, however, such as a lack of opportunity for full-time work and slack business conditions.
The percentage of employees working part time for economic reasons in the Tenth District is lower than the nation as a whole. The fraction of employed workers employed part time for economic reasons was 4 percent nationally in August 2016, compared to 3.3 percent in the District (calculated by the authors using June CPS microdata). For workers in the LMI community, reluctant part-timers make up 6.3 percent of the employed population in the United States and 4.7 percent in the Tenth District._
Underemployment may be a growing concern in light of projections on job growth and associated qualifications. BLS Employment Projections for 2014-24 indicate that positions with little to no need for significant formal education or experience account for most of the 10 occupations with the greatest projected job growth._ In addition, reports from the Economic Policy Institute, the New York Fed and the Center for College Affordability highlight a pressing issue of underemployment among college graduates. Although a historic phenomenon, steep increases in underemployment occurred during the recoveries from the 2001 and 2007 recessions._ Researchers propose several explanations for growing underemployment, such as older workers delaying retirement, low aggregate demand and recessionary consequences._
Minority Unemployment
Recent concerns about persistent unemployment among minorities and unemployment gaps have tempered positive developments in the labor market. The Hispanic unemployment rate in August 2016 was 5.6 percent, higher than the national rate of 4.9 percent and the rate for white workers of 4.4 percent. The unemployment rate in August for black workers was 8.1 percent. While unemployment rates for minorities have declined along with the national unemployment rate, the unemployment gap has persisted over time (Chart 6). Nevertheless, the gap has been on a modest decline over the last 40 years.
Chart 6: Minority Unemployment Rate Gaps
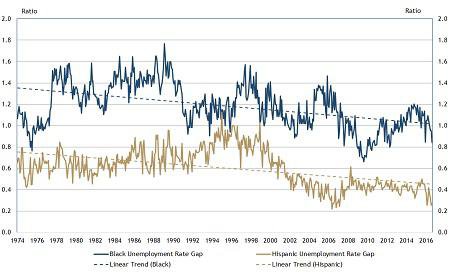
Note: The gap is measured by the difference between the minority unemployment rate and the white unemployment rate, divided by the white unemployment rate.
(Source: U.S. Bureau of Labor Statistics; Haver Analytics)
The July LMI Survey asked a special question about persistent disparities in labor market outcomes along racial and ethnic lines and requested examples of programs that respondents believe have worked well or have good potential for reducing disparities._ As might be expected with a question posed to providers of services to the LMI population, most responses are relevant to the LMI population more generally and focused on LMI minorities.
Figure 1 shows a word cloud of survey respondents’ answers to the special question._ “Need” was the most frequent word in respondents’ answers. In addition to job opportunities and skills, “need” commonly was associated with transportation and child care. That is, a lack of suitable, reliable transportation and the difficulty in finding affordable child care are significant constraints to minority workers attaining and retaining employment. Contacts indicated the most effective programs consider these issues outside the workplace, but noted some constraints as well. For example, efforts to assist LMI workers with transportation needs in rural areas are more complex and likely would require significant innovations.
Figure 1: Wordcloud of Responses to Question on Minority Unemployment
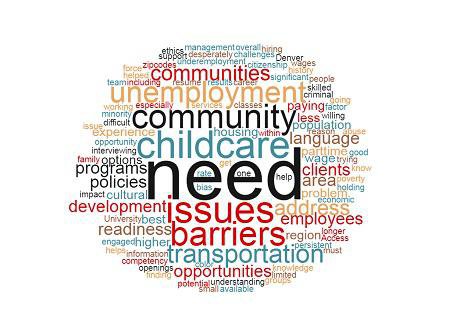
Notes: A word cloud creates a visual representation of frequency of words in a text document. The size of each word represents frequency in the document. Limitations include the differentiation of word tenses, words used sparingly and words addressing the question itself. We made edits to the original word cloud to remove errors and words which only appeared in the text document once.
(Source: Federal Reserve Bank of Kansas City LMI Survey)
A lack of basic skills or work readiness was noted as a crucial issue by many respondents. One contact summarized this problem as “not understanding what would be expected of them as an employee.” Examples of work readiness issues cited were showing up for work and on time, dressing appropriately for the position and interacting appropriately with co-workers and customers. Also raised were language barriers and cultural understanding, along with issues about immigration more generally. Programs focusing on these basic skills generally were applauded as typically yielding good results.
Many survey respondents cited criminal and credit histories as problematic. These issues have been raised often in past LMI surveys. Those with a criminal history and/or drug use are generally classified as “hard to employ” among those in the workforce development arena. The labor market outlook for those with criminal or drug histories is rather dim, although they would be expected to have better job search outcomes as the labor market tightens._ While the majority of jobs for which lower-skilled minority workers apply do not currently require a check of credit histories, the share that does has been increasing._ Employment related credit reports differ from those arising from lender inquiries and do not include the credit score._
Respondents suggested that mentorship programs could provide new employees with a guide for training purposes and build trust between existing and new employees. Additional programs noted by contacts include efforts to reduce criminal record penalties and create additional paths to citizenship. And as seen in the word cloud, many other suggestions were offered.
Although the special question in the LMI Survey focused specifically on factors other than education, education is a critical factor affecting racial and ethnic labor market disparities. Two recent reports by Georgetown University’s Center on Education and the Workforce highlight issues that are not commonly addressed in conversation on minority employment gaps and education. The researchers find high concentrations of minorities obtaining degrees in majors that typically lead to lower-paying jobs. The Center’s research also suggests that the most critical factor in the choice of major (and college) is pre-entry academic qualifications that can be tied to the academic rigor of the high school attended, and in some cases, colleges commonly attended by minorities lack the majors that lead to more lucrative jobs.
Affordable Housing
Contacts continue to report that the stock of affordable housing in their communities is insufficient. Moreover, the LMI Affordable Housing Indexes are down significantly since mid-2013, and the decline has been consistent. Other than the forward-looking index of expectations, the indexes have fallen to their lowest values since the depth of the 2007 recession. Respondents commonly indicate affordable housing is the most significant issue facing LMI communities.
A special question in the July survey inquired about the stock of affordable housing and funding for construction. Figure 2 displays the word cloud of the respondents’ answers._ The responses often were critical of affordable housing programs, as conveyed in the word cloud by the terms “low,” “limited” and “difficult.” They noted that federal, state, and local governments are the major funders of affordable housing projects, but their support has declined in recent years amid budget pressures. Contacts reported that these financial strains have greatly limited the supply of affordable housing across the District. These sentiments can be seen in the words “homeless,” “issue,” and “need.”
Figure 2: Wordcloud of Responses to Question on Affordable Housing
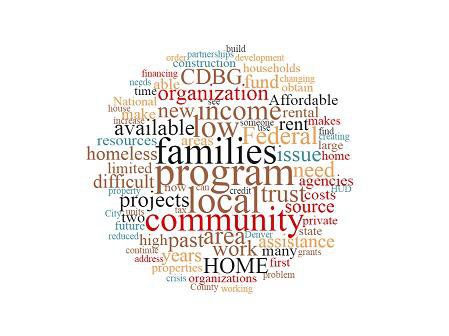
Notes: A word cloud creates a visual representation of frequency of words in a text document. The size of each word represents frequency in the document. Limitations include the differentiation of word tenses, words used sparingly and words addressing the question itself. We made edits to the original word cloud to remove errors and words which only appeared in the text document less than three times.
(Source: Federal Reserve Bank of Kansas City LMI Survey)
The word cloud also shows that respondents discussed the lack of funding, singling out Community Development Block Grants (CDBG) and the HOME Investments Partnership Program (HOME). These funds, created by the U.S. Department of Housing and Urban Development (HUD), provide grants to states and localities to fund the construction, purchase and rehabilitation of affordable housing, or direct rental assistance for LMI families._ While CDBG funds can be used for a variety of community needs, HOME funds are tied specifically to affordable housing needs. HOME funds can be used for direct assistance to LMI households, or as funds for local governments or nonprofits to build or refurbish housing.
Funding from CDBG and HOME has decreased in recent years. In the case of the CDBG, housing funds have decreased steadily since 2011, but this decline may be due to the overall decline in CBDG disbursements._ A similar situation has occurred with HOME funding—both overall funding and the number of projects committed to and completed by local Community Housing Development Organizations (CHDOs) has decreased significantly since 2013. The percentage of authorized projects committed decreased from 100 percent in 2008 to 26.9 percent in 2015._ In addition, the percentage of committed projects that was funded decreased from 100 percent to 10.5 percent._
Survey contacts noted that the decline in project approvals and implementation may stem from new HUD regulations on HOME funds._ Specifically, qualification requirements for CHDOs were changed, and some nonprofits have lost their CHDO qualification and no longer can allocate funds. Additionally, new examination costs may increase the cost of housing development, making it unaffordable for some jurisdictions. An additional issue raised was a perceived increase in restrictive county-level zoning laws. The Urban Institute argues that zoning laws have increased the fiscal and temporal costs of housing construction._
Chart 7: LMI Affordable Housing Index
The Sample composition broadened with this survey, and therefore this quarter's results may not be directly comparable to those in the January survey.
(Source: Federal Reserve Bank of Kansas City LMI Survey)
Access to Credit
Indicators of access to credit (perception relative to previous quarter and year and expectations for the following quarter) remained stable in the July survey but continue to indicate deteriorating conditions. The indexes increased significantly and consistently from the start of the survey in the first quarter of 2009 through 2013, but since have fluctuated around 80 to 90, just below neutral. A large majority of respondents reported no change in access to credit. Some respondents noted the complexity in providing credit alongside financial literacy education. One such solution involved providing more regular information on credit scores, which would allow borrowers to understand the long-term implications of their use of credit._
Appendix: Diffusion Indexes For Low-and Moderate Income Survey Responses

Endnotes
[1] The Federal Reserve Bank of Kansas City’s biannual LMI Survey measures the economic conditions of LMI populations and the organizations that serve them. Survey results are used to construct five indicators of economic conditions in LMI communities and two indicators of conditions faced by organizations that serve them. The goal is to provide a gauge for service providers, policymakers and others to assess changes over time in the economic conditions of the LMI population.
[2] A larger share of respondents (46.5 percent) reported that conditions had worsened than had improved (2.3 percent), leading to the consensus reading well below neutral. The computation of the index value is 2.3 - 46.5 + 100 = 55.8.
[3] See “Who Is On Food Stamps, By State,” Governing, undated. Accessible at External Linkhttp://www.governing.com/gov-data/food-stamp-snap-benefits-enrollment-participation-totals-map.html and the March 3, 2016, issue of the Tenth District LMI Economic Conditions report.
[4] Examples of media reports about inadequate nutritional needs include Tanni Deb, “CMU Raises Child Hunger Awareness,” KKCO 11 News, April 19, 2016 (accessible at External Linkhttp://www.nbc11news.com/content/news/CMU-raises-child-hunger-awareness-376292821.html); Karla James, “Food Bank for the Heartland Raising Awareness During Hunger Action Month,” Nebraska Radio Network, Sept. 2, 2016 (accessible at External Linkhttp://nebraskaradionetwork.com/2016/09/02/food-bank-for-the-heartland-raising-awareness-during-hunger-action-month/); Bryan Thompson, “One In Five Kansas Children Live In ‘Food Insecure’ Households,” KCUR, April 29, 2016 (accessible at External Linkhttp://kcur.org/post/one-five-kansas-children-live-food-insecure-households#stream/0); Dean Torske, “Fighting Food Insecurity in Rural Nebraska,” Scottsbluff Star Herald, Aug. 11, 2016 (accessible at External Linkhttp://www.starherald.com/news/local_news/fighting-food-insecurity-in-rural-nebraska/article_7b540f15-f2f9-55b5-a658-f1ec718c034f.html); Franque Thompson, “Tulsa Architect Firms Partner with Food Banks to Create Awareness About Hunger,” KTUL, Aug. 20, 2016 (accessible at External Linkhttp://ktul.com/news/local/tulsa-architect-firms-partner-with-food-bank-to-create-awareness-about-hunger).
[5] Data on 211 calls provided by the United Way of Greater Kansas City. Power or Water Service Repayment Assistance is defined as total electric, natural gas or water payment assistance related calls.
[6] LIHEAP, State Fact Sheets. Accessible at External Linkhttp://liheap.org/.
[7] The calculation is 80.4 (2015 value on chart) / 109.8 (2011 value on chart) - 1 ≈ 27 percent.
[8] See the March 3 issue of the Tenth District LMI Economic Conditions Report for a more detailed discussion of the impact of energy intensity.
[9] See Labor Market Conditions Indicators
[10] The Tenth District unemployment rate is available in the Kansas City Fed’s Tenth District Economic Databook,. Latest issue September 21.
[11] See U.S. Bureau of Labor Statistics, Employment Situation, Table A-15, “Alternative measures of labor underutilization.” Accessible at External Linkhttp://www.bls.gov/news.release/empsit.t15.htm.
[12] An insufficient amount of data are available for the Tenth District in the CPS database to provide a reliable U-6 number. Marginally attached workers make up a very small share of those who are not in the labor force.
[13] See, for example, “Early Childhood Poverty and Adult Achievement, Employment, and Health,” Family Matters, 2013, vol. 93, pp. 27-35.
[14] See National Employment Law Project, “Part Time Workers and Unemployment Insurance.” Accessible at External Linkhttp://nelp.org/content/uploads/2015/03/parttimeui0304.pdf. Further, UI typically is available for a maximum of 26 weeks, although
[15] Extended benefits may be available depending on temporary extensions passed by Congress and state unemployment rates and unemployment compensation policies. See Center on Budget and Policy Priorities, “Introduction to Unemployment Insurance,” July 31, 2014. Accessible at External Linkhttp://www.cbpp.org/research/introduction-to-unemployment-insurance.
[16] Here the term “LMI worker” is used broadly to consist of workers in LMI families or those who live in LMI communities. See Arnaud Chevalier and Gauthier Lanot, “The Relative Effect of Family Characteristics and Financial Situation on Educational Achievement,” Education Economics, 2002, vol. 10, no. 2, pp. 165-181.
[17] Calculated by the authors using microdata from June 2016 Current Population Survey, available at External Linkhttp://www.nber.org/cps/ .
[18] See Sondra G. Beverly and Michael Sherraden, “Institutional Determinants of Saving: Implications for Low-Income Households and Public Policy,” The Journal of Socio-Economics, 1999, vol. 28, no. 4, pp. 457-473. See also Michael S. Barr, “Financial Services, Savings and Borrowing Among Low- and Moderate-Income Households: Evidence from the Detroit Area Household Financial Services Survey,” 3rd Annual Conference on Empirical Legal Studies Papers, 2008. Accessible at External Linkhttp://dx.doi.org/10.2139/ssrn.1121195.
[19] See Willem Van Zandweghe, “Interpreting the Recent Decline in Labor Force Participation,” Federal Reserve Bank of Kansas City, Economic Review, 2012, vol. 97, no. 1, pp. 5-34.
[20] Details can be found in Van Zandweghe, op. cit.
[21] See Van Zandweghe, op. cit.
[22] Here the term “LMI worker” is used broadly to consist of workers in LMI families or those who live in LMI communities, as determined by CPS microdata.
[23] U.S. Bureau of Labor Statistics, Economic and Employment Projections: 2014-24 Summary. Accessible at External Linkhttp://www.bls.gov/news.release/ecopro.toc.htm.
[24] See Jaison R. Abel, Richard Deitz and Yaqin Su, “Are Recent College Graduates Finding Good Jobs?” Federal Reserve Bank of New York, Current Issues in Economics and Finance, 2014, vol. 20, no. 1. Accessible at External Linkhttps://www.newyorkfed.org/medialibrary/media/research/current_issues/ci20-1.pdf.
[25] On retirement age, see Richard Vedder, Christopher Denhart, and Jonathan Robe, “Why Are Recent College Graduates Underemployed?” Center for College Affordability and Productivity, January 2013. Accessible at External Linkhttp://centerforcollegeaffordability.org/uploads/Underemployed%20Report%202.pdf. On aggregate demand, see Teresa Kroeger, Tanyell Cooke and Elise Gould, “The Class of 2016,” Economic Policy Institute, April 21, 2016. Accessible at External Linkhttp://www.epi.org/publication/class-of-2016/.
[26] The specific question asked was “Please provide your perspective on persistently high unemployment rates among African American and Hispanic workers. Other than disparities in educational attainment and work experience, what workforce issues affecting minority workers are most critical to address? In your experience, what programs or policies have most successfully assisted African American and Hispanic workers in achieving sustainable employment? Which factors contributed to the program or policy’s success?”
[27] A word cloud creates a visual representation of frequency of words in a text document. The size of each word represents frequency in the document. Limitations include the differentiation of word tenses, words used sparingly and words addressing the question itself. We made edits to the original word clouds to remove errors and words which only appeared in the text document once.
[28] Scott H. Decker et al., "Criminal Stigma, Race, Gender, and Employment: An Expanded Assessment of the Consequences of Imprisonment for Employment," U.S. Department of Justice, 2014. Accessible at External Linkhttps://www.ncjrs.gov/pdffiles1/nij/grants/244756.pdf.
[29] See Katie Porter, "More Supreme Court Action on Credit Issues," Credit Slips, September 28, 2006. Accessible at External Linkhttp://www.creditslips.org/creditslips/2006/09/more_supreme_co.html
[30] See John Ulzheimer, "Credit Scores and Jobs: Reality Check for Job Hunters," CBS Money Watch, July 22, 2010. Accessible at External Linkhttp://www.cbsnews.com/news/credit-scores-and-jobs-reality-check-for-job-hunters/.
[31] Due to the large frequency of words in the responses, all words that appeared in the text document less than three times were removed.
[32] See HUD, "Community Development Block Grant Program - CDBG," Accessible at External Linkhttp://portal.hud.gov/hudportal/HUD?src=/program_offices/comm_planning/communitydevelopment/programs. See also HUD, "HOME Investment Partnerships Program," Accessible at External Linkhttp://portal.hud.gov/hudportal/HUD?src=/program_offices/comm_planning/affordablehousing/programs/home/.
[33] U.S. Department of Housing and Urban Development, CBDG State Disbursements Expenditure Reports. Accessible at External Linkhttps://www.hudexchange.info/manage-a-program/cdbg-expenditure-reports/.
[34] U.S. Department of Housing and Urban Development Department (HUD), PR20 HOME – Production Report. Accessible at External Linkhttps://www.hudexchange.info/resource/reportmanagement/published/HOME_Prod_Natl_20160630.pdf.
[35] Ibid.
[36] A full list of the 2013 Final Rule changes can be found on the HUD website at External Linkhttps://www.hudexchange.info/home/home-final-rule/highlights-of-the-changes-in-the-home-final-rule/.
[37] Jason Furman, “Barriers to Shared Growth: The Case of Land Use Regulation and Economic Rents,” Remarks made at The Urban Institute, November 20, 2015. Accessed at External Linkhttps://www.whitehouse.gov/sites/default/files/page/files/20151120_barriers_shared_growth_land_use_regulation_and_economic_rents.pdf.
[38] Joanne Gaskin, FICO (Fair Isaac Corp.), presentation at National Conference: Exploring Financial Resiliency and Mobility, Federal Reserve Bank of Kansas City, September 7, 2016. Accessed at External Linkhttps://www.youtube.com/watch?v=zsYShFFvQq0&feature=youtu.be.
Endnotes
-
1
The Federal Reserve Bank of Kansas City’s biannual LMI Survey measures the economic conditions of LMI populations and the organizations that serve them. Survey results are used to construct five indicators of economic conditions in LMI communities and two indicators of conditions faced by organizations that serve them. The goal is to provide a gauge for service providers, policymakers and others to assess changes over time in the economic conditions of the LMI population.
-
2
A larger share of respondents (46.5 percent) reported that conditions had worsened than had improved (2.3 percent), leading to the consensus reading well below neutral. The computation of the index value is 2.3 - 46.5 + 100 = 55.8.
-
3
See “Who Is On Food Stamps, By State,” Governing, undated. Accessible at External Linkhttp://www.governing.com/gov-data/food-stamp-snap-benefits-enrollment-participation-totals-map.html and the March 3, 2016, issue of the Tenth District LMI Economic Conditions report.
-
4
Examples of media reports about inadequate nutritional needs include Tanni Deb, “CMU Raises Child Hunger Awareness,” KKCO 11 News, April 19, 2016 (accessible at External Linkhttp://www.nbc11news.com/content/news/CMU-raises-child-hunger-awareness-376292821.html); Karla James, “Food Bank for the Heartland Raising Awareness During Hunger Action Month,” Nebraska Radio Network, Sept. 2, 2016 (accessible at External Linkhttp://nebraskaradionetwork.com/2016/09/02/food-bank-for-the-heartland-raising-awareness-during-hunger-action-month/); Bryan Thompson, “One In Five Kansas Children Live In ‘Food Insecure’ Households,” KCUR, April 29, 2016 (accessible at External Linkhttp://kcur.org/post/one-five-kansas-children-live-food-insecure-households#stream/0); Dean Torske, “Fighting Food Insecurity in Rural Nebraska,” Scottsbluff Star Herald, Aug. 11, 2016 (accessible at External Linkhttp://www.starherald.com/news/local_news/fighting-food-insecurity-in-rural-nebraska/article_7b540f15-f2f9-55b5-a658-f1ec718c034f.html); Franque Thompson, “Tulsa Architect Firms Partner with Food Banks to Create Awareness About Hunger,” KTUL, Aug. 20, 2016 (accessible at External Linkhttp://ktul.com/news/local/tulsa-architect-firms-partner-with-food-bank-to-create-awareness-about-hunger).
-
5
Data on 211 calls provided by the United Way of Greater Kansas City. Power or Water Service Repayment Assistance is defined as total electric, natural gas or water payment assistance related calls.
-
6
LIHEAP, State Fact Sheets. Accessible at External Linkhttp://liheap.org/.
-
7
The calculation is 80.4 (2015 value on chart) / 109.8 (2011 value on chart) - 1 ≈ 27 percent.
-
8
See the March 3 issue of the Tenth District LMI Economic Conditions Report for a more detailed discussion of the impact of energy intensity.
- 9
-
10
The Tenth District unemployment rate is available in the Kansas City Fed’s Tenth District Economic Databook.
-
11
See U.S. Bureau of Labor Statistics, Employment Situation, Table A-15, “Alternative measures of labor underutilization.” Accessible at External Linkhttp://www.bls.gov/news.release/empsit.t15.htm.
-
12
An insufficient amount of data are available for the Tenth District in the CPS database to provide a reliable U-6 number. Marginally attached workers make up a very small share of those who are not in the labor force.
-
13
See, for example, “Early Childhood Poverty and Adult Achievement, Employment, and Health,” Family Matters, 2013, vol. 93, pp. 27-35.
-
14
See National Employment Law Project, “Part Time Workers and Unemployment Insurance.” Accessible at External Linkhttp://nelp.org/content/uploads/2015/03/parttimeui0304.pdf. Further, UI typically is available for a maximum of 26 weeks, although
-
15
Extended benefits may be available depending on temporary extensions passed by Congress and state unemployment rates and unemployment compensation policies. See Center on Budget and Policy Priorities, “Introduction to Unemployment Insurance,” July 31, 2014. Accessible at External Linkhttp://www.cbpp.org/research/introduction-to-unemployment-insurance.
-
16
Here the term “LMI worker” is used broadly to consist of workers in LMI families or those who live in LMI communities. See Arnaud Chevalier and Gauthier Lanot, “The Relative Effect of Family Characteristics and Financial Situation on Educational Achievement,” Education Economics, 2002, vol. 10, no. 2, pp. 165-181.
-
17
Calculated by the authors using microdata from June 2016 Current Population Survey, available at External Linkhttp://www.nber.org/cps/.
-
18
See Sondra G. Beverly and Michael Sherraden, “Institutional Determinants of Saving: Implications for Low-Income Households and Public Policy,” The Journal of Socio-Economics, 1999, vol. 28, no. 4, pp. 457-473. See also Michael S. Barr, “Financial Services, Savings and Borrowing Among Low- and Moderate-Income Households: Evidence from the Detroit Area Household Financial Services Survey,” 3rd Annual Conference on Empirical Legal Studies Papers, 2008. Accessible at External Linkhttp://dx.doi.org/10.2139/ssrn.1121195.
-
19
See Willem Van Zandweghe, “Interpreting the Recent Decline in Labor Force Participation,” Federal Reserve Bank of Kansas City, Economic Review, 2012, vol. 97, no. 1, pp. 5-34.
-
20
Details can be found in Van Zandweghe, op. cit.
-
21
See Van Zandweghe, op. cit.
-
22
Here the term “LMI worker” is used broadly to consist of workers in LMI families or those who live in LMI communities, as determined by CPS microdata.
-
23
U.S. Bureau of Labor Statistics, Economic and Employment Projections: 2014-24 Summary. Accessible at External Linkhttp://www.bls.gov/news.release/ecopro.toc.htm.
-
24
See Jaison R. Abel, Richard Deitz and Yaqin Su, “Are Recent College Graduates Finding Good Jobs?” Federal Reserve Bank of New York, Current Issues in Economics and Finance, 2014, vol. 20, no. 1. Accessible at External Linkhttps://www.newyorkfed.org/medialibrary/media/research/current_issues/ci20-1.pdf.
-
25
On retirement age, see Richard Vedder, Christopher Denhart, and Jonathan Robe, “Why Are Recent College Graduates Underemployed?” Center for College Affordability and Productivity, January 2013. Accessible at External Linkhttp://centerforcollegeaffordability.org/uploads/Underemployed%20Report%202.pdf. On aggregate demand, see Teresa Kroeger, Tanyell Cooke and Elise Gould, “The Class of 2016,” Economic Policy Institute, April 21, 2016. Accessible at External Linkhttp://www.epi.org/publication/class-of-2016/.
-
26
The specific question asked was “Please provide your perspective on persistently high unemployment rates among African American and Hispanic workers. Other than disparities in educational attainment and work experience, what workforce issues affecting minority workers are most critical to address? In your experience, what programs or policies have most successfully assisted African American and Hispanic workers in achieving sustainable employment? Which factors contributed to the program or policy’s success?”
-
27
A word cloud creates a visual representation of frequency of words in a text document. The size of each word represents frequency in the document. Limitations include the differentiation of word tenses, words used sparingly and words addressing the question itself. We made edits to the original word clouds to remove errors and words which only appeared in the text document once.
-
28
Scott H. Decker et al., "Criminal Stigma, Race, Gender, and Employment: An Expanded Assessment of the Consequences of Imprisonment for Employment," U.S. Department of Justice, 2014. Accessible at External Linkhttps://www.ncjrs.gov/pdffiles1/nij/grants/244756.pdf.
-
29
See Katie Porter, "More Supreme Court Action on Credit Issues," Credit Slips, September 28, 2006. Accessible at External Linkhttp://www.creditslips.org/creditslips/2006/09/more_supreme_co.html
-
30
See John Ulzheimer, "Credit Scores and Jobs: Reality Check for Job Hunters," CBS Money Watch, July 22, 2010. Accessible at External Linkhttp://www.cbsnews.com/news/credit-scores-and-jobs-reality-check-for-job-hunters/.
-
31
Due to the large frequency of words in the responses, all words that appeared in the text document less than three times were removed.
-
32
See HUD, "Community Development Block Grant Program - CDBG," Accessible at External Linkhttp://portal.hud.gov/hudportal/HUD?src=/program_offices/comm_planning/communitydevelopment/programs. See also HUD, "HOME Investment Partnerships Program," Accessible at External Linkhttp://portal.hud.gov/hudportal/HUD?src=/program_offices/comm_planning/affordablehousing/programs/home/.
-
33
U.S. Department of Housing and Urban Development, CBDG State Disbursements Expenditure Reports. Accessible at External Linkhttps://www.hudexchange.info/manage-a-program/cdbg-expenditure-reports/.
-
34
U.S. Department of Housing and Urban Development Department (HUD), PR20 HOME – Production Report. Accessible at External Linkhttps://www.hudexchange.info/resource/reportmanagement/published/HOME_Prod_Natl_20160630.pdf.
-
35
Ibid.
-
36
A full list of the 2013 Final Rule changes can be found on the HUD website at External Linkhttps://www.hudexchange.info/home/home-final-rule/highlights-of-the-changes-in-the-home-final-rule/.
-
37
Jason Furman, “Barriers to Shared Growth: The Case of Land Use Regulation and Economic Rents,” Remarks made at The Urban Institute, November 20, 2015. Accessed at External Linkhttps://www.whitehouse.gov/sites/default/files/page/files/20151120_barriers_shared_growth_land_use_regulation_and_economic_rents.pdf.
-
38
Joanne Gaskin, FICO (Fair Isaac Corp.), presentation at National Conference: Exploring Financial Resiliency and Mobility, Federal Reserve Bank of Kansas City, September 7, 2016. Accessed at External Linkhttps://www.youtube.com/watch?v=zsYShFFvQq0&feature=youtu.be.