Business formation in the United States had been on a long-term decline before COVID-19 set off a recession in the U.S. economy._ Recessions tend to accelerate ongoing changes in the economy, and the pandemic might be expected to have hastened the decline in business formation (Howes 2020; Muro and others 2020). Surprisingly, the pandemic appears instead to have had the opposite effect: business applications have actually surged over the past few months.
Chart 1 shows that the rate of business formation (new businesses as a percentage of total businesses) declined by over one-third from the 1980s through 2018. Moreover, three of the last four recessions seem to have reinforced this trend, with the decline steepening either just before or during the recession.
Chart 1: Declining Business Formation over Time
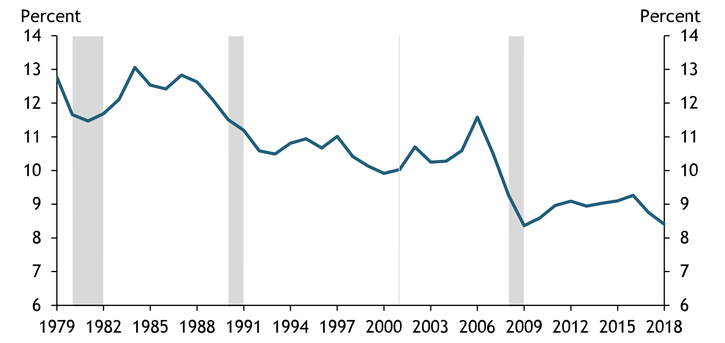
Note: Gray bars denote years containing any months in a National Bureau of Economic Research (NBER)-defined recession.
Sources: U.S. Census Bureau and NBER (Haver Analytics).
Although Chart 1 is useful in illustrating past trends in business formation, the data series ends in 2018. To examine more recent changes in business formation, I use a relatively new, high-frequency data set produced by the U.S. Census Bureau called “Business Formation Statistics.” The data contain weekly counts on the number of new business applications filed both for businesses without planned wages (hereafter, “general business applications”) as well as for businesses with planned wages and for corporations.
Chart 2 shows that throughout 2019 and the first three months of 2020, application growth was essentially flat for general businesses, businesses with planned wages, and corporations. In late March, when many states instituted stay-at-home orders, application growth declined sharply for all three business types. General business applications, for example, declined by 37 percent.
Chart 2: U.S. Business Application Growth Surges in Second Half of 2020
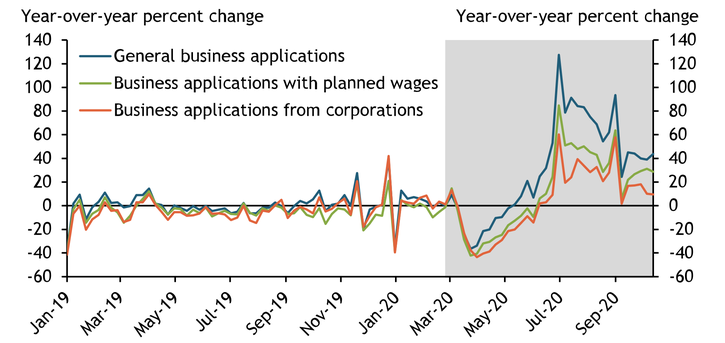
Note: Gray shading indicates an NBER-defined recession.
Sources: U.S. Census Bureau and NBER (Haver Analytics).
Since late spring, however, the trend has reversed. Application growth has surged, especially for general businesses, and growth for all three business types has not only recovered from their initial drop in March but also exceeded their levels one year ago. The strong recovery and additional growth in applications relative to previous years together suggest that COVID-19 has disrupted prior trends in business formation. This disruption is even more apparent for general businesses, which are likely small, sole proprietorships.
One possible explanation for the sustained growth in general business applications is the overall shock to labor markets from the pandemic. People who lost employment due to the pandemic and associated shutdowns may have tried to create their own opportunities by starting a business. To investigate this possibility, I examine whether business application growth was stronger in states with greater increases in unemployment.
In contrast to the “creating opportunities” hypothesis, I find no relationship between unemployment and business application growth. Chart 3 shows that states with a larger percentage-point increase in their unemployment rate from January to September 2020 did not experience higher average general business application growth between mid-May and mid-October. In other words, the recent increase in business applications does not appear to have been driven by people who lost jobs during the pandemic.
Chart 3: Business Application Growth Appears Unrelated to State-Level Unemployment
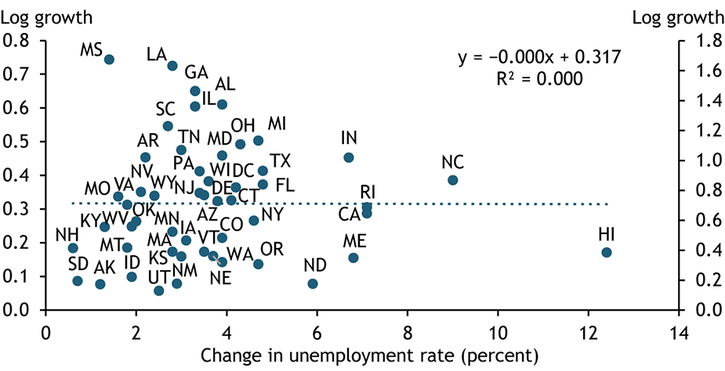
Sources: U.S. Census Bureau and Bureau of Labor Statistics (Haver Analytics).
Another possible explanation for the surge in business applications is the flexibility that accompanies remote work or “teleworkable” jobs. Recent research has shown that teleworkable jobs represented a smaller share of total jobs lost in the early stages of the pandemic (Tüzemen and Tran 2020). Business formation may be more possible for occupations that can be performed from home. Alternatively, people may have had more time from less commuting to consider their own business ventures. To investigate this possibility, I examine whether states with a higher average share of teleworkable jobs in 2019 had higher general business application growth between mid-May and mid-October._
In contrast to this “flexibility hypothesis,” I find essentially no relationship between teleworkable jobs and business application growth. Chart 4 shows that states with a higher share of teleworkable jobs in 2019 did not experience higher business application growth. In sum, neither unemployment nor work-from-home jobs appear to explain the surge in business formation during the pandemic.
Chart 4: Business Application Growth Appears Unrelated to Share of “Teleworkable” Jobs
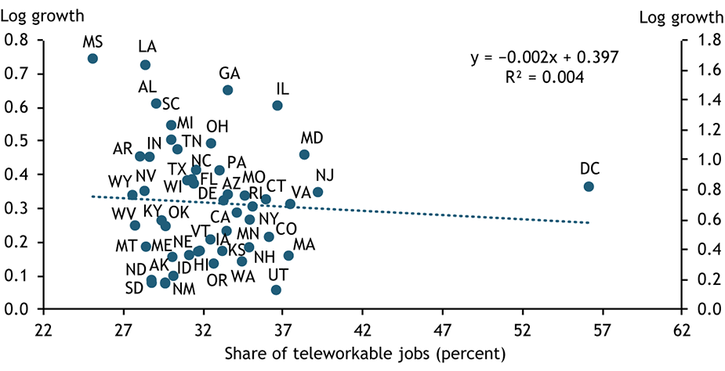
Sources: U.S. Census Bureau and Bureau of Labor Statistics.
Nevertheless, the pandemic appears to have created the conditions for people to consider their own business ventures. These conditions could include a lower cost of business formation during the pandemic. The prevalence of remote work, for example, may have reduced the need for renting office space. At the same time, if office vacancy rates are rising due to an increase in remote work, renting space may now be cheaper for entrepreneurs. In addition, the pandemic may also have created the need for new products and services or increased the demand for existing products. Data to examine these possibilities are limited, and future research is needed to explore them.
Although application growth remains higher today than before COVID-19, it is too early to tell if this shift is temporary or permanent. New businesses often bring new ideas or more efficient ways of delivering goods and services. If permanent, an increase in the rate of business formation could have implications for the shape of the recovery as well as future innovation and productivity growth in the U.S. economy.
Endnotes
-
1
The exact reason for the long-term decline is unknown, but some have pointed to the shifting sectoral composition in the U.S. economy, especially movement away from manufacturing toward services (Decker and others 2016).
-
2
I am grateful to Didem Tüzemen for providing data on teleworkable jobs following methodology used in Tüzemen and Tran (2020).
References
Decker, Ryan A., John Haltiwanger, Ron S. Jarmin, and Javier Miranda. 2016. “External LinkDeclining Business Dynamism: What We Know and the Way Forward.” American Economic Review, vol. 106, no. 5, pp. 203–207.
Howes, Cooper. 2020. “External LinkWhy Does Structural Change Accelerate in Recessions? The Credit Reallocation Channel.” PhD dissertation, University of Texas at Austin.
Muro, Mark, Tracy Hadden Loh, Martha Ross, Jenny Schuetz, Annelies Goger, Nicole Bateman, William H. Frey, Joseph Parilla, Sifan Liu, and Adie Tomer. 2020. “External LinkHow COVID-19 Will Change the Nation’s Long-Term Economic Trends, According to Brookings Metro Scholars.” Brookings Institution, April 14.
Tüzemen, Didem, and Thao Tran. 2020. “Were Teleworkable Jobs Pandemic-Proof?” Federal Reserve Bank of Kansas City, Economic Bulletin, September 30.
Jason P. Brown is a research and policy officer at the Federal Reserve Bank of Kansas City. The views expressed are those of the author and do not necessarily reflect the positions of the Federal Reserve Bank of Kansas City or the Federal Reserve System.