As the economy recovers from the COVID-19 pandemic, many labor market measures—including the KC Fed LMCI—suggest the labor market has tightened (Glover, Mustre-del-Río, and Pollard 2021). In a tight labor market, the number of job openings is high relative to the number of job seekers; as a result, workers may be able to find jobs more easily and are likely to receive higher wages. However, firms may have a harder time filling positions in a tight market and may incur higher labor costs, thereby inducing a “wage-price spiral” in which higher wages lead firms to increase prices on goods and services, which, in turn, lead workers to negotiate higher wages. Although this spiral suggests labor markets can become “too tight,” economists debate when exactly labor markets become sufficiently tight to risk driving up inflation._
The Federal Reserve Bank of Kansas City’s Labor Market Conditions Indicators (LMCI) may offer a timely signal of whether current labor market activity is inflationary. The LMCI extracts information from 24 labor market variables, including measures of current labor market conditions (such as the current unemployment rate, average hourly earnings, and the share of long-term unemployed) as well as the trajectory of labor market conditions (such as the job-finding rate, announced job cuts, and percent of firms planning to increase employment soon). It then consolidates information from these variables into a “level of activity” indicator, which signals current labor market tightness, and a “momentum” indicator, which signals which direction tightness may trend in the near future.
Chart 1 shows that increases in the level of activity indicator predict increases in wage growth, as measured by the Federal Reserve Bank of Atlanta’s Wage Growth Tracker. Specifically, the chart illustrates the relationship between wage growth and the LMCI between March 1997, when the Atlanta Fed Wage Growth Tracker is first available, through August 2021. The green dots correspond to months when LMCI momentum is negative, while the blue dots correspond to months when LMCI momentum is positive. The solid “best-fit” lines in Chart 1 are approximately parallel and show that a one-unit increase in the LMCI level of activity is associated with a roughly 0.8 percent increase in wage growth regardless of whether momentum is positive or negative.
Chart 1: Wage Growth Rises When LMCI Activity Increases
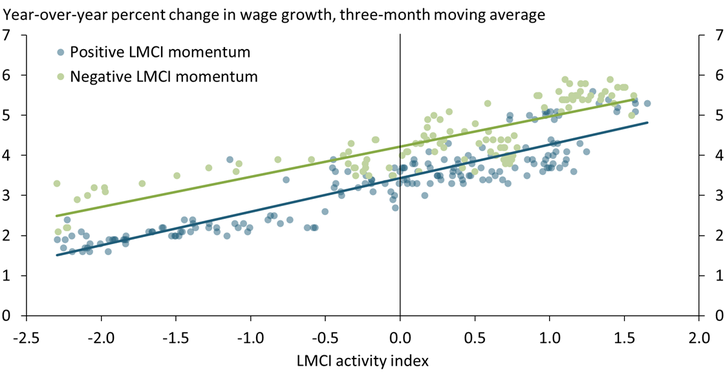
Notes: The Atlanta Fed’s Wage Growth Tracker, which measures nominal wage growth over 12 months for the median wage earner, is updated monthly and available continuously starting in March 1997. The LMCI is available monthly starting in January 1992.
Sources: Federal Reserve Banks of Atlanta and Kansas City.
Of course, wage inflation does not always lead to price inflation, and the LMCI shows that a tighter labor market is associated with price inflation only when momentum is negative. Chart 2 plots annual inflation, measured by the price index for personal consumption expenditures (PCE), against the LMCI level of activity from January 1992 through August 2021. As in Chart 1, blue dots represent months when momentum was positive, and green dots represent months when momentum was negative. The best-fit lines demonstrate a key difference between wage inflation and price inflation: when momentum is positive (blue line), the level of activity and price inflation show no systematic relationship, but when momentum is negative (green line), they have a significantly positive association. In other words, an increase in the LMCI level of activity when momentum is positive indicates the labor market has the potential to improve without driving up inflation; in contrast, an increase in LMCI activity when momentum is negative signals an increase in price inflation, which may be driven by wage inflation.
Chart 2: Higher LMCI Activity Is Associated with Higher PCE Inflation Only When Momentum Is Negative
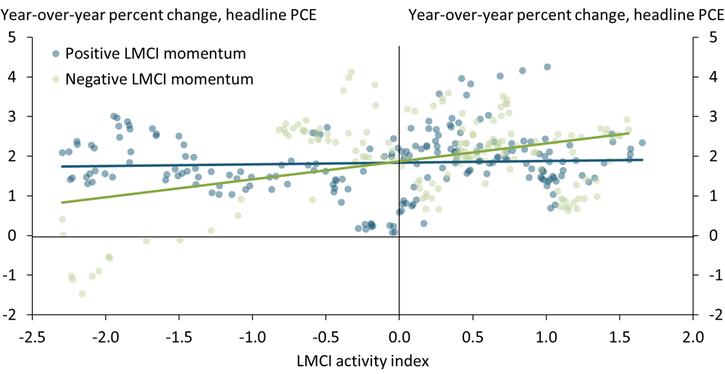
Sources: Bureau of Economic Analysis (BEA) and Federal Reserve Bank of Kansas City.
To quantify how much LMCI activity and momentum can account for wage and goods inflation, we estimate simple linear regressions of different inflation rates on LMCI activity and momentum as well as the product of the two indicators. We use data going as far back as possible (March 1997 for wages and January 1992 for the LMCI) through February 2020, just prior to the pandemic.
Table 1 shows that the LMCI was associated with wage and price inflation through the beginning of the COVID-19 pandemic in the United States. The first column reports our estimates for wage inflation, the second column corresponds to PCE inflation, and the final column corresponds to core PCE inflation, which excludes more volatile energy and food prices. Across each variable, an increase in the level of activity tends to increase inflation, as shown by positive values, while higher momentum tends to reduce inflation, as shown by negative values. These estimates indicate that an increase in the LMCI level of activity, holding momentum constant, signals tighter labor markets, while higher momentum, holding the level of activity constant, signals more slack in labor markets. The third row shows that higher momentum reduces the marginal effect of activity on inflation, especially for the PCE measures where the magnitude of this interaction is the same or larger than the direct estimate on activity. For example, for PCE inflation, the coefficient on activity and momentum’s interaction is −0.39, while the direct effect of activity is 0.18, which means that we expect an increase in activity to raise inflation only if momentum is below 46 basis points._ In sum, Table 1 provides empirical support to the relationships shown in Charts 1 and 2: higher LMCI activity boosts wage growth but is inflationary only when momentum is low or negative.
Table 1: Inflation Measures Increase with Activity, Decrease with Momentum and Their Interaction

Notes: Newey-West standard errors reported in parentheses. Estimation samples extend from the origin of each series through February 2020, before the pandemic took hold in the United States.
Sources: BEA and Federal Reserve Banks of Atlanta and Kansas City.
In 2021, as the economy has been recovering from the pandemic crisis, inflation has been above 2 percent and labor markets have recovered rapidly, especially as measured by LMCI activity (Glover, Mustre-del-Río, and Pollard 2021). How much can labor market tightness account for recent wage and price inflation?
To help answer this question, we first calculate the averages of wage growth and year-on-year price inflation for each month from January to September 2021 and present them in the “Realized” column of Table 2. We then compare these averages to those predicted using the LMCI, presented in the “LMCI-predicted” column. Comparing the columns shows that wage inflation has averaged 3.7 percent in 2021, only 18 basis points above what we would have predicted based on the LMCI. PCE inflation, however, has averaged 2.82 percent, which is more than one percentage point above the LMCI-predicted rate of 1.67 percent. Although core PCE inflation is closer to the LMCI’s prediction, it is still 76 basis points (2.53 – 1.77) higher on average. In short, the LMCI suggests that though labor market tightness can explain wage inflation, price inflation is well above what labor markets would predict.
Table 2: The LMCI Accounts for 2021 Wage Growth, Predicts Substantially Less Price Inflation

Note: Estimation samples extend from the origin of each series through February 2020, before the pandemic took hold in the United States.
Sources: BEA and Federal Reserve Banks of Atlanta and Kansas City.
In sum, the LMCI indicates that tight labor markets as measured by the LMCI’s level of activity indicator may increase wage inflation, but only increase goods inflation when momentum is negative. Intuitively, tighter labor markets induce firms to raise wages to attract workers, but they do not pass the higher costs to customers (as measured by PCE inflation) in an improving economy. Because LMCI momentum has been positive throughout 2021, the excess PCE inflation observed cannot be accounted for by labor market activity. This provides evidence against a wage-price spiral explanation for recent inflation and suggests that inflationary pressures may ease going forward as long as labor markets maintain momentum._
Endnotes
-
1
For example, Coibion, Gorodnichenko, and Ulate (2018) argue that estimates of potential output understate the amount of slack in the U.S. economy from 2009–17. The summary of the discussion of their paper at the Brookings Conference highlights the breadth of views on measuring economic slack among prominent macroeconomists.
-
2
This calculation uses the estimates from Table 1 to calculate the effect of a one-unit increase in activity on PCE inflation during a given month t for an arbitrary level of momentum. The effect is equal to 0.18 − 0.39 * momentumt. This expression is positive for any value of momentumt below 0.46 = 0.18 / 0.39 and negative for any value above 0.46.
-
3
LMCI momentum was 0.62 in September 2021, which is well above zero and high by historical standards: momentum has been below this value for 80 percent of the LMCI’s existence.
References
Coibion, Olivier, Yuriy Gorodnichenko, and Mauricio Ulate. 2018. “External LinkThe Cyclical Sensitivity in Estimates of Potential Output.” Brookings Papers on Economic Activity, Fall, pp. 343–441.
Coibion, Olivier, Yuriy Gorodnichenko, and Mauricio Ulate. 2018. “External LinkThe Cyclical Sensitivity in Estimates of Potential Output.” Brookings Papers on Economic Activity, Fall, pp. 343–441.
Glover, Andrew, José Mustre-del-Río, and Emily Pollard. 2021. “External LinkKC Fed LMCI Implies the Labor Market Is Closer to a Full Recovery than the Unemployment Rate Alone Suggests.” Federal Reserve Bank of Kansas City, Economic Bulletin, October 19.
Glover, Andrew, José Mustre-del-Río, and Emily Pollard. 2021. “External LinkKC Fed LMCI Implies the Labor Market Is Closer to a Full Recovery than the Unemployment Rate Alone Suggests.” Federal Reserve Bank of Kansas City, Economic Bulletin, October 19.
Andrew Glover is a senior economist at the Federal Reserve Bank of Kansas City. José Mustre-del-Río is a research and policy officer at the bank. Emily Pollard is an associate economist at the bank. The views expressed are those of the authors and do not necessarily reflect the positions of the Federal Reserve Bank of Kansas City or the Federal Reserve System.