Assessing the tightness of the labor market during the ongoing COVID-19 pandemic has been challenging: some measures (such as wage growth) suggest a tight labor market, while others (such as the labor force participation rate) suggest slack remains.
The Kansas City Fed’s Labor Market Conditions Indicators (LMCI) can resolve this tension by consolidating information from 24 labor market variables into two indicators: the level of activity, which reflects the current state of the labor market, and momentum, which reflects the trajectory of the labor market and future conditions._ Chart 1 shows that the level-of-activity indicator from the LMCI can be a useful proxy for traditional measures of labor market tightness: as the job finding rate (vertical axis) increases, so, too, does the level of activity (horizontal axis).
Chart 1: Higher Monthly Readings of the Level-of-Activity Indicator Are Systematically Associated with a Higher Job Finding Rate
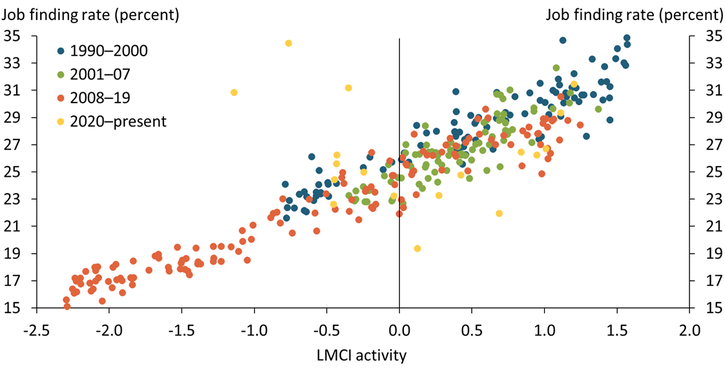
Sources: Bureau of Labor Statistics (BLS), Federal Reserve Bank of Kansas City’s Labor Market Conditions Indicators (LMCI), and authors’ calculations.
Chart 1 also shows that the relationship between the level of activity and the job finding rate has been stable over time. For example, comparing the blue, green, and orange dots suggests the relationship between the level of activity and job finding rate was very similar in the 1990s, early 2000s, and the decade following the Great Recession. This stability is remarkable given the substantial changes in the economy over these three decades. Although this relationship broke down somewhat in the early part of the pandemic (yellow dots), it appears to have returned more recently.
Given the consistency of the level-of-activity indicator in gauging labor market tightness, the LMCI may also provide useful information about the unemployment rate, a key measure of labor market health that depends on labor market tightness. Chart 2 shows that adjusting the unemployment rate using the LMCI’s level-of-activity and momentum indicators provides a more robust measure of the tightness of the labor market._ Historically, the official unemployment rate (blue line) and the LMCI-implied unemployment rate (green line) have tracked each other. However, the LMCI-implied unemployment rate has deviated from the official rate in a few notable ways. For example, prior to both the 2001 recession and the Great Recession of 2007–09, the LMCI-implied unemployment rate began to rise before the official rate, suggesting the former is a timelier indicator of downturns in the labor market. Additionally, following the Great Recession, the LMCI-implied unemployment rate remained above the official rate for several years. This divergence coincides with a period when the labor force participation rate was declining, and many observers noted the unemployment rate was artificially depressed by the lack of participation. By incorporating information from the labor force participation rate and other measures, the LMCI-implied unemployment rate was able to capture this additional slack.
Chart 2: The LMCI-Implied Unemployment Rate Signals Greater Improvement in the Labor Market following the Pandemic
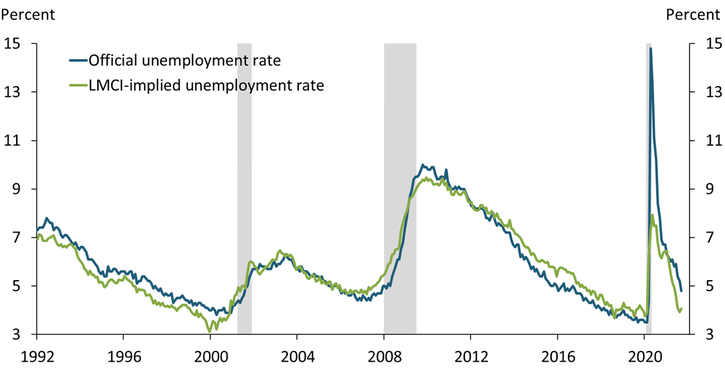
Note: Gray shaded areas represent National Bureau of Economic Research (NBER)-defined recessions.
Sources: BLS, Federal Reserve Bank of Kansas City’s LMCI, NBER, and authors’ calculations.
More recently, the LMCI-implied unemployment rate suggests the labor market has improved more than what the official rate suggests. Indeed, while the official unemployment rate currently stands at 4.8 percent, the LMCI-implied unemployment rate is 4.1 percent. However, as the two measures can differ in levels for extended periods of time, comparing relative changes is more useful. In December 2020, the official unemployment rate stood at 6.7 percent, 3.2 percentage points above its pre-pandemic level of 3.5 percent. Thus, based on official estimates, the unemployment rate has closed just under 60 percent of its gap relative to its pre-pandemic level. In contrast, over the same time horizon, the LMCI-implied unemployment rate has closed 91 percent of its gap relative to its pre-pandemic level (3.8 percent). Overall, the LMCI-implied unemployment rate hints at greater improvement in the labor market since December 2020.
By summarizing a wide range of labor market measures, the LMCI can provide a consistent gauge of labor market tightness that accounts for other labor market dynamics not directly captured by the official unemployment rate. Adjusting the unemployment rate to incorporate information from the LMCI yields a more robust and timelier indicator of labor market tightness. In addition, the LMCI-implied unemployment rate has shown greater improvement than the official rate since December 2020, implying that the labor market may be closer to pre-pandemic levels than would be judged by the official unemployment rate alone.
Endnotes
-
1
Additional details on the Labor Market Conditions Indicators can be found at External Linkhttps://www.kansascityfed.org/data-and-trends/labor-market-conditions-indicators/
-
2
More formally, we run a linear regression of the unemployment rate against the level of activity, momentum, and the interaction between activity and momentum. For similar calculations, see Hakkio and Willis (2014) or Gilchrist and Hobijn (2021).
References
Diamond, Peter A. 1982. “External LinkAggregate Demand Management in Search Equilibrium.” Journal of Political Economy, vol. 90, no. 5, pp. 881–894.
Gilchrist, Troy, and Bart Hobijn. 2021. “External LinkThe Divergent Signals about Labor Market Slack.” Federal Reserve Bank of San Francisco, Economic Letter, June 1.
Hakkio, Craig S., and Jonathan L. Willis. 2014. “External LinkKansas City Fed’s Labor Market Conditions Indicators (LMCI)” Federal Reserve Bank of Kansas City, The Macro Bulletin, August 28.
Mortensen, Dale T., and Christopher A. Pissarides. 1994. “External LinkJob Creation and Job Destruction in the Theory of Unemployment.” Review of Economic Studies, vol. 61, no. 3, pp. 397–415.
Andrew Glover is a senior economist at the Federal Reserve Bank of Kansas City. José Mustre-del-Río is a research and policy officer at the bank. Emily Pollard is an associate economist at the bank. The views expressed are those of the authors and do not necessarily reflect the positions of the Federal Reserve Bank of Kansas City or the Federal Reserve System.