The failure of Silicon Valley Bank (SVB) on March 10, 2023, was the largest bank failure since the 2007–08 financial crisis, raising concerns about spillovers to other banks and systemic risk. The Board of Governors of the Federal Reserve System, together with the Federal Deposit Insurance Corporation (FDIC) and the U.S. Treasury, acted quickly to invoke the systemic risk exception and thereby guarantee the uninsured deposits of SVB customers as well as those of Signature Bank in New York, which failed on March 12 (U.S. Department of Treasury, Board of Governors, and FDIC 2023). On March 22, Federal Reserve Chair Jerome Powell made a case for the systemic risk exception by noting that “isolated banking problems, if left unaddressed, can undermine confidence in healthy banks and threaten the ability of the banking system as a whole to play its vital role in supporting the savings and credit needs of households and businesses” (Board of Governors 2023). Because households and businesses depend significantly on credit to support spending, any disruption in credit availability is likely to lower spending.
Taking into account the actions of the Fed, the FDIC, and the Treasury, the March banking stress did not appear to have a serious negative effect on spending, at least at the national level. Chart 1 shows that while regional bank stock returns (left panel, green line) have remained depressed relative to overall stock returns (blue line) since the failure of SVB, aggregate consumer spending (right panel) has been resilient.
Chart 1: March banking stress depressed bank stock returns but not aggregate consumer spending
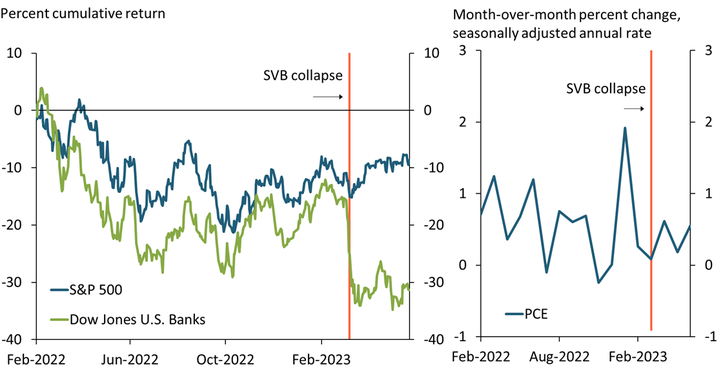
Notes: Left panel plots cumulative returns on a daily basis for indexes from Choi, Goldsmith-Pinkham, and Yorulmazer (2023). Right panel shows nominal personal consumption expenditures (PCE).
Sources: Choi, Goldsmith-Pinkham, and Yorulmazer (2023) and Federal Reserve Bank of St. Louis (FRED).
This disconnect between banking conditions and macroeconomic conditions raises a question: did the SVB failure really pose a risk that could have threatened the national economy? Answering this question with national data can be challenging because we do not know what would have happened to the national economy without the policy response. Aggregate spending data may be confounded by emergency policy actions—for example, the establishment of the Bank Term Funding Program and the systemic risk exception—intended to prevent spillovers to other banks. One way to circumvent this challenge is to examine differences in spending across geographically disaggregated areas—for example, individual counties—that had different degrees of exposure to the SVB failure._ Thus, we use two high-frequency credit and debit card spending datasets available at a more geographically disaggregated level. The first, Fiserv, measures consumer spending using transaction data provided by merchants. The second, Verisk, uses transaction data provided by customers._
The more disaggregated, county-level data show that while state-level spending was little changed after the SVB failure, spending indeed declined in counties more exposed to the failure. The left panel of Chart 2, calculated using Fiserv data, shows the spending ratio of California relative to the nation, indexed to its January 2019 level at 1. A lower level of the ratio implies that spending in California is lower relative to the United States as a whole. The black vertical lines show that the ratio experienced two structural breaks in 2022, both associated with a decline in relative spending in California. However, neither of these breaks is associated with the SVB failure, suggesting the failure did not have a substantial effect on state-level spending. Although the blue line shows that spending in California indeed declined relative to the nation during the week of the SVB failure (orange line), the spending ratio subsequently rebounded.
Chart 2: County-level data from California show a decline in local consumer spending after the SVB failure, though state-level spending was little changed
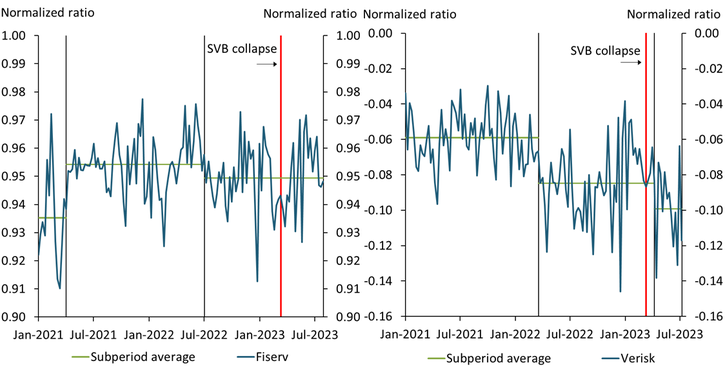
Notes: Left panel shows the ratio between spending in California and spending in the United States as a whole. Right panel shows the difference in spending between the average of five Californian counties with SVB branches and San Diego County, which has no SVB branches. We test for breaks in the average spending trend using the Bai and Perron (1998) statistic.
Sources: Fiserv, Inc.; Verisk/Commerce Signals, Category Spend Tracker and Merchant Spend Tracker; and authors’ calculations.
To assess potential differences in spending in counties more or less exposed to the SVB failure, the right panel of Chart 2—calculated using Verisk data—shows the ratio between average spending in five California counties (Napa, Los Angeles, San Francisco, San Mateo, Santa Clara) with SVB branches and spending in San Diego County, which does not have an SVB branch. As in the left panel, we normalize spending relative to its 2019 level (in this case, average spending in 2019). This panel shows a structural break (black vertical line) after the SVB failure in the second week of April. In addition, this panel shows that after the SVB failure, average spending in counties more exposed to the SVB failure declined relative to the less exposed San Diego County. Although the decline in spending is modest, subsequent movements in the ratio were not sufficient to restore relative spending to its pre-SVB-failure level.
What could explain this pattern? Recent studies using high-frequency spending data show that though spending in areas affected by a natural disaster rebounds after the disruption, it does not fully return to its pre-disaster trend, leaving some permanent scarring effects on the level of spending (Aladangady and others 2022). The failure of SVB may represent a sort of natural disaster for some counties in California in particular: the bank was a major player in payroll processing for a significant number of companies in the Bay area and generated a substantial share of loans to wineries concentrated in the Napa Valley as well as commercial real estate loans (Council and Bote 2023; Frank 2023; Goldenstein 2023). One hypothesis is that even though all of SVB’s deposits were guaranteed, short-run disruptions in the processing time may have affected consumer confidence and consumers’ precautionary savings motives. Indeed, even though bank failures are low-likelihood events, SVB’s failure might have changed the expectations of people who were directly affected through “experience effects” (Malmendier and Wachter, forthcoming). Another hypothesis is that consumer spending dropped due to a contraction in local lending for businesses that had ongoing relationships and credit lines with SVB. Testing these hypotheses using additional datasets on banking lending is beyond the scope of this bulletin.
In summary, using multiple high-frequency spending datasets, we find evidence for a modest decline in spending after the SVB failure in California counties most exposed to the failure. However, this localized decline does not appear to have had any meaningful spillover effect on aggregate spending, just as the decline in stock prices among banks does not appear to have had any meaningful effect on returns of a broad stock market index such as the S&P 500. Our findings are consistent with the view that the emergency actions taken after the SVB failure helped contain spillovers.
Endnotes
-
1
If the difference in exposure to the SVB failure across different areas is perfectly correlated with the difference in exposure to policy actions, disaggregated data would not help us in sorting out the confounding channel. However, the perfect correlation is a very restrictive assumption that is unlikely to hold in practice.
-
2
The dataset from Fiserv, Inc. draws on information provided by merchants who process credit and debit card transactions on a daily basis; the geographical information is determined by their physical locations. We aggregate the daily data to the weekly data to reduce the noise in the daily data and adjust the data to eliminate the seasonal effect. Unfortunately, we are not able to obtain the geographical granularity beyond the state level from Fiserv. The dataset from Verisk draws weekly credit and debit card transaction information for cardholders to further investigate the spending pattern at the county level. In this dataset, the location is identified by the residence of a cardholder. Thus, if a cardholder residing in Santa Clara County spends money outside of Santa Clara County, the spending would still be associated with Santa Clara County.
References
Aladangady, Aditya, Shifrah Aron-Dine, Wendy Dunn, Laura Feiveson, Paul Lengerman, and Claudia Sahm. 2022. “From Transaction Data to Economic Statistics Constructing Real-Time, High-Frequency, Geographic Measures of Consumer Spending,” in Katharine G. Abraham, Ron S. Jarmin, Brian C. Moyer, and Matthew D. Shapiro, eds., Big Data for Twenty-First-Century Economic Statistics. Chicago: University of Chicago Press.
Bai, Jushan, and Pierre Perron. 1998. “External LinkEstimating and Testing Linear Models with Multiple Structural Changes.” Econometrica, vol. 66, no. 1, pp. 47–78.
Board of Governors of the Federal Reserve System. 2023. “External LinkTranscript of Chair Powell’s Press Conference, March 22, 2023.”
Choi, Dong Beom, Paul Goldsmith-Pinkham, and Tanju Yorulmazer. 2023. “External LinkContagion Effects of the Silicon Valley Bank Run.” ArXiv preprint, August 12.
Council, Stephen, and Joshua Bote. 2023. “External LinkSF Payroll Firm Rippling Has to Delay Payouts after Silicon Valley Bank Collapse.” SFGate, March 10.
Frank, Mitch. 2023. "External LinkWhat Happens When a Favorite Bank for the Wind Industry Collapses?” Wine Spectator, March 14.
Goldenstein, Matthew. 2023. "External LinkBank Crisis Could Cast Pall Over Commercial Real Estate Market.” New York Times, March 22.
Malmendier, Ulrike, and Jessica A. Wachter. Forthcoming. “Memory of Past Experiences and Economic Decisions.” Oxford Handbook of Human Memory.
U.S. Department of the Treasury, Board of Governors of the Federal Reserve System, and Federal Deposit Insurance Corporation (FDIC). 2023. “External LinkJoint Statement by Treasury, Federal Reserve, and FDIC.” Press release, March 12.
Edmund S. Crawley is a senior economist at the Board of Governors of the Federal Reserve System. Taeyoung Doh is a senior economist at the Federal Reserve Bank of Kansas City. Minchul Shin is an Economic Advisor and Machine Learning Economist at the Federal Reserve Bank of Philadelphia. The views expressed are those of the authors and do not necessarily reflect the positions of the Federal Reserve Bank of Kansas City, the Federal Reserve Bank of Philadelphia, or the Federal Reserve System.