Inflation spiked in 2021 alongside a sharp rise in corporate profits, bringing substantial attention to the role of firms in determining inflation._ Previous research has shown that corporate profits contributed substantially to inflation in the first half of 2021; however, the contribution of profits began to fall in the second half of 2021, a time when inflation accelerated (Glover, Mustre-del-Río, and von Ende-Becker 2023). This pattern is consistent with anticipatory price-setting, in which firms expect higher costs of production in the near future and thus raise prices on the goods they produce today._
This pattern also appears consistent with previous economic recoveries. The idea that firms are forward-looking when setting prices is not specific to the post-pandemic recovery. Economic theory predicts that the contribution of corporate profits to inflation should spike whenever costs are temporarily depressed but expected to increase in the near future; as the recovery continues and costs rise, the contribution of profits to inflation should fall. Chart 1 confirms that this pattern appears in U.S. data going back to the late 1940s. The chart plots the year-over-year contribution of corporate profits to inflation in the implicit GDP deflator—a measure of average prices for goods and services in the economy—in each quarter since 1948. Inflation from corporate profits spikes sharply in the first few quarters after the end of a recession (shaded in gray), and then falls as the recovery continues.
Chart 1: Inflation from corporate profits typically spikes at the start of recoveries
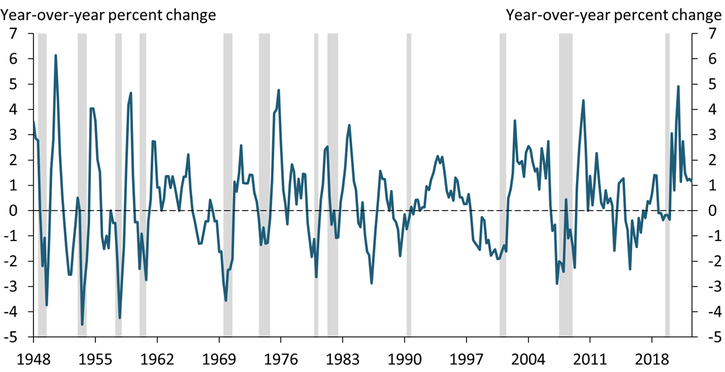
Note: Gray bars denote National Bureau of Economic Research (NBER)-defined recessions.
Sources: U.S. Bureau of Economic Analysis (BEA) and NBER (Haver Analytics).
The contribution of corporate profits appears not only consistent with prior recessions, but also proportionate. Chart 2 takes a closer look at the contribution from corporate profits to inflation during past recoveries by comparing its path over the four quarters before each recession ended and during the eight quarters after. The light blue lines represent inflation from corporate profits during each of the 11 recoveries from 1948 through 2020, the dark blue line shows their average, and the orange line shows the current recovery. Inflation from corporate profits follows a pattern: corporate profits are deflationary during the recession, then put considerable upward pressure on inflation in the first year of the recovery. Two years (eight quarters) after a recession ends, corporate profits make a relatively small positive contribution to inflation. The orange line shows that there was qualitatively nothing unique about the path of profit-generated inflation during the pandemic recovery.
Chart 2: Inflation from corporate profits peaks a year into recoveries and falls in the second year
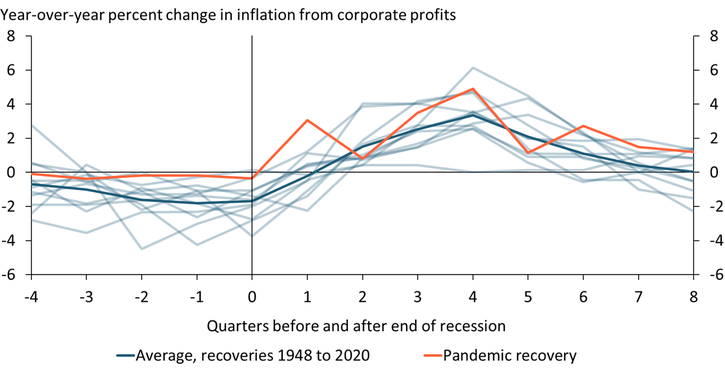
Source: BEA.
Although the absolute level that corporate profits contributed to inflation during the pandemic recovery was higher than in most other recoveries, overall inflation was also higher. To control for the higher level of inflation during the pandemic recovery, Chart 3 quantifies the share of inflation accounted for by corporate profits (versus costs) in the first two years following a recession and again shows similarities between the most recent and prior recoveries. The blue bars in Chart 3 show that during the first year of the average pre-pandemic recovery, corporate profits contributed more than 100 percent of overall inflation—on average, profits contributed 126 percent and costs contributed −26 percent. Put another way, in the first year of a pre-pandemic recovery, inflation would have averaged 3.4 percent if the only contributor had been growth in corporate profits; however, because costs typically fell during this period, the actual average inflation rate was only 2.7 percent.
Chart 3: Share of corporate profits’ contribution to inflation in the pandemic recovery was similar to historical recoveries
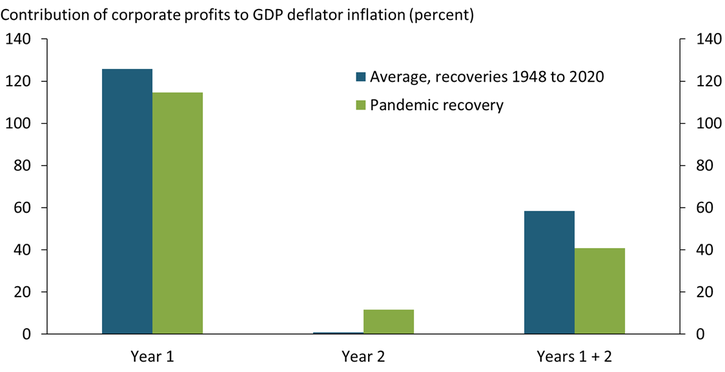
Source: BEA.
In the second year of pre-pandemic recoveries, corporate profits contributed much less to overall inflation; instead, costs contributed most. The green bars in Chart 3 show that the first two years following the COVID-19 recession follow a strikingly similar pattern to prior recoveries: corporate profits contributed a large percentage to inflation in the first year and contributed much less in the second. Perhaps surprisingly, corporate profits actually contributed less to inflation during the first two years of the pandemic recovery compared with the historical average (41 percent versus 59 percent, respectively). Overall, patterns in Chart 3 are consistent with firms raising prices in the first year of a recovery in anticipation of higher future costs, which are realized in the second year of a recovery. Because of these pricing decisions, the contribution of corporate profits to inflation rises the first year and falls the second.
Although inflation has been atypically high during the recovery from the pandemic, the contribution of corporate profits to inflation has not been unprecedented. Our findings support the theory that firms set prices based on current as well as future production costs, which explains the contribution of corporate profits to inflation both before and after the COVID-19 pandemic. The amount of inflation generated by corporate profits early in a recovery may be a useful signal of future cost growth and subsequent inflation.
Endnotes
References
Galí, Jordi. 2008. Monetary Policy, Inflation, and the Business Cycle: An Introduction to the New Keynesian Framework and Its Applications. Princeton University Press.
Glover, Andrew, José Mustré-del-Río, and Alice von Ende-Becker. 2023. “External LinkHow Much Have Record Corporate Profits Contributed to Recent Inflation?” Federal Reserve Bank of Kansas City, Economic Review, vol. 108, no. 1, pp. 23–35.
Hannon, Paul. 2023. “External LinkWhy Is Inflation So Sticky? It Could Be Corporate Profits.” Wall Street Journal, May 2.
Kaplan, Juliana. 2023. “External LinkThe Real Monster Behind Soaring Prices.” Insider, May 2.
Weber, Isabella M., and Evan Wasner. 2023. “External LinkSellers’ Inflation, Profits and Conflict: Why Can Large Firms Hike Prices in an Emergency?” Review of Keynesian Economics, vol. 11, no. 2, pp. 183–213.
Andrew Glover is a senior economist at the Federal Reserve Bank of Kansas City. José Mustre-del-Río is a research and policy officer at the bank. Jalen Nichols is a research associate at the bank. The views expressed are those of the authors and do not necessarily reflect the positions of the Federal Reserve Bank of Kansas City or the Federal Reserve System.