Although bank deposits are relatively cheap and stable sources of funding for banks, they are subject to market forces. When the Federal Open Market Committee (FOMC) began raising interest rates in March 2022, yields on many financial instruments also rose, providing depositors and investors with a variety of higher-yielding opportunities. For example, some depositors may have chosen to move funds from savings accounts into money market accounts with higher interest rates or invest in other liquid assets such as short-term Treasury bills. These outflows, in turn, may force banks to increase their offered deposit rates to retain funding. Community banks in particular may be vulnerable to deposit outflows because they are more dependent on deposit funding than larger banks—due, in part, to their limited ability to access broader funding markets.
Chart 1: Community bank funding has shifted to higher-cost alternatives
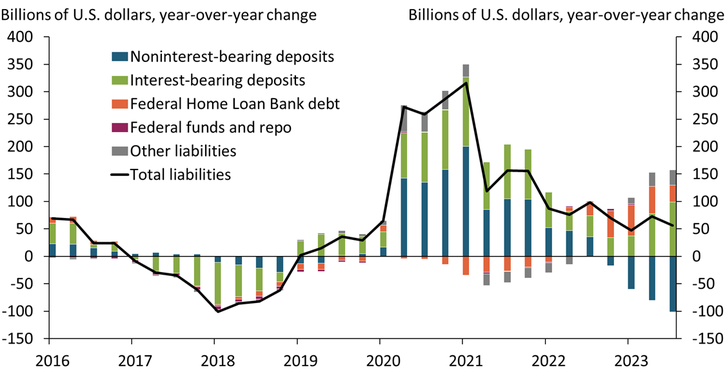
Notes: Other liabilities include non-Federal Home Loan Bank (FHLB) debt and deferred tax and expenses. Federal funds and repurchase agreements (repo) have increased by only small amounts during the time period shown.
Source: Federal Financial Institutions Examination Council (FFIEC).
Chart 1 illustrates the composition of community bank liabilities and shows that as interest rates increased, community banks saw the greatest declines in deposit accounts that paid no interest—or noninterest-bearing deposits (blue bars)._ Balances in these accounts began to decline in late 2022, and the declines have accelerated each quarter since. However, community banks were able to counter these outflows by attracting depositors into higher yielding—or interest-bearing—accounts (green bars). The remainder of community banks’ balance sheet growth has primarily been funded through non-deposit sources of funds such as Federal Home Loan Bank (FHLB) advances (orange bars) and other liabilities (gray bars), which can include long-term debt issuance and borrowings from the Federal Reserve’s Bank Term Funding Program (BTFP) and discount window.
Although bank deposits have been declining in aggregate across the banking system, they have been relatively stable at community banks (FDIC 2023). Chart 2 shows that community banks have experienced only modest year-over-year outflows so far in 2023. Despite the relative stability of deposits as a funding source, the composition of community banks’ deposit base has changed markedly. Chart 2 shows that the pandemic-era build-up in deposits was largely driven by inflows of transaction (blue bars) and savings deposits (green bars). These deposit types are likely to have low (or, in the case of transaction deposits, even 0 percent) interest rates. Perhaps unsurprisingly, many of these deposits—particularly, savings deposits—have flowed out of those accounts more recently, as higher interest rates have made other interest-bearing accounts more lucrative. In response, community banks have increasingly issued time deposits, which have longer maturities and often pay higher rates than non-maturity deposits such as transaction and savings accounts.
Chart 2: The composition of community banks’ deposits has changed markedly
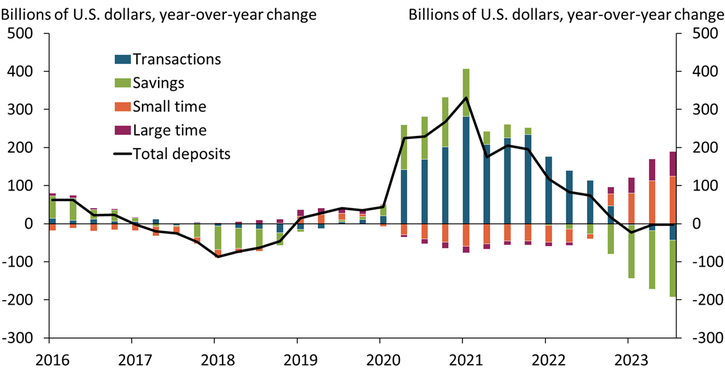
Notes: Savings deposits include money market demand accounts (MMDA). Small time deposits have balances of $250,000 or less. Large time deposits have balances of more than $250,000.
Source: FFIEC.
On net, the increase in time deposit issuance has helped community banks retain deposits and rely less on non-deposit funding sources than larger banks. Compared with community banks, larger banks saw stronger deposit growth during the 2020–21 period followed by greater and more persistent deposit outflows in 2022 (FDIC 2023). One reason for community banks’ better ability to attract and retain depositors could be their relationship-based business model. Small banks are more likely to make close, personal connections with their depositors, potentially allowing them to encourage customers to move their funds into higher-yielding deposit accounts rather than to alternative investments outside the bank.
However, as benchmark interest rates have increased, funding costs have risen at community banks. Rising funding costs can crimp bank profitability and increase borrowers’ credit costs as banks pass on higher rates and tighten lending standards. Community banks’ greater reliance on deposit funding has mitigated the size of their funding cost increases, though. Chart 3 shows that average deposit yields at community banks have increased by about 200 basis points since monetary policy tightening started in early 2022 (blue line). In contrast, average yields paid on non-deposit liabilities (green line) have climbed by a similar amount but remain higher than average deposit yields. By limiting their use of non-deposit liabilities, community banks have kept their funding cost increases to a minimum.
Chart 3: Deposit funding remains cheaper than other borrowings
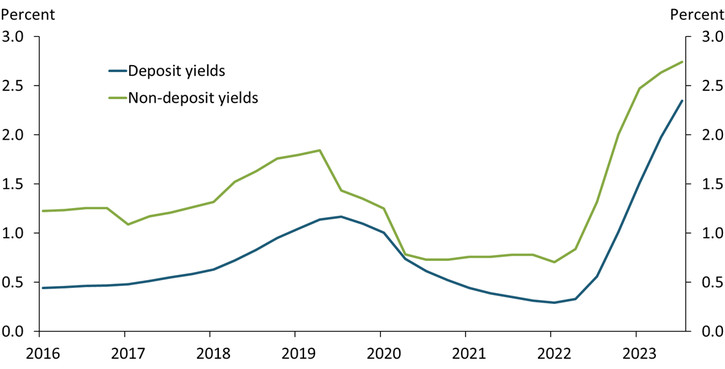
Note: Yield is defined as total interest expense in a category divided by that category’s average quarterly balance.
Source: FFIEC.
Even with this greater reliance on deposit funding, community banks still face funding risks. Increasingly, community banks have relied on more volatile, interest-sensitive deposits sourced from brokers, listing services, and reciprocal arrangements. Brokered, listed, and reciprocal deposits increased from about 7 percent of total deposits at year-end 2021 to nearly 13 percent of total deposits by the end of 2023:Q3. Indeed, the FDIC has raised concerns about the stability of brokered deposits in the recent past (Tate 2023). Reciprocal deposits, though generally deemed safer, also carry some stability risks (Gandel 2023). Moreover, community banks’ dependence on large time deposits may also pose risks. Should interest rates move down, banks will still be forced to pay interest on these deposits at the higher rate while yields on assets fall, potentially squeezing profitability. Banks dependent on time deposits could see funding costs remain high for some time due to time deposits’ fixed interest rates and long maturities while banks that retain more non-maturity deposits would see funding costs decline._
Overall, community banks have successfully limited their use of non-deposit funding during a period of increasing interest rates by retaining deposit funding, which has helped keep overall funding costs relatively low. This dynamic suggests that the community bank business model has been successful at mitigating rising funding costs to some degree at least. However, community banks have also shifted into less stable and longer-maturity deposits, exposing them to risks of deposit outflows and relatively higher funding costs should the current economic scenario materially change.
Endnotes
-
1
Community banks are defined as commercial banks in holding companies with less than $10 billion in banking assets.
-
2
When rates fall, the marginal cost of funding will likely fall commensurately with rates. That is, newly issued certificates of deposit (CDs) will pay lower market rates than older vintages of CDs. As the older CDs mature, average costs will fall.
References
FDIC (Federal Deposit Insurance Corporation). 2023. “External LinkQuarterly Banking Profile.” Third Quarter 2023.
Gandel, Stephen. 2023. “External LinkU.S. Regional Banks Swap $220bn in Deposits to Soothe Insurance Nerves.” Financial Times, May 23.
Tate, Brian C. 2023. “External LinkThere Is No Need for the FDIC to Tinker with Its Brokered Deposit Rule.” American Banker, September 11.
Brendan Laliberte is a research associate at the Federal Reserve Bank of Kansas City. W. Blake Marsh is a senior economist at the bank. Padma Sharma is an economist at the bank. The views expressed are those of the authors and do not necessarily reflect the positions of the Federal Reserve Bank of Kansas City or the Federal Reserve System.