To combat surging inflation, the Federal Open Market Committee (FOMC) is moving to withdraw policy accommodation by increasing the federal funds rate and reducing the Federal Reserve’s nearly $9 trillion balance sheet. Chart 1 shows that the balance sheet expanded dramatically at the onset of the pandemic, when the FOMC aggressively purchased assets to alleviate severe strains in Treasury and agency mortgage-backed securities (MBS) markets. The FOMC then continued asset purchases at a reduced pace through March 2022. In total, purchases of Treasury and agency MBS held in the System Open Market Account (SOMA) led the balance sheet to more than double in size, from less than $4.2 trillion in 2019 to more than $8.9 trillion at the end of May 2022.
Chart 1: Quantitative tightening is projected to significantly reduce the Federal Reserve’s asset holdings
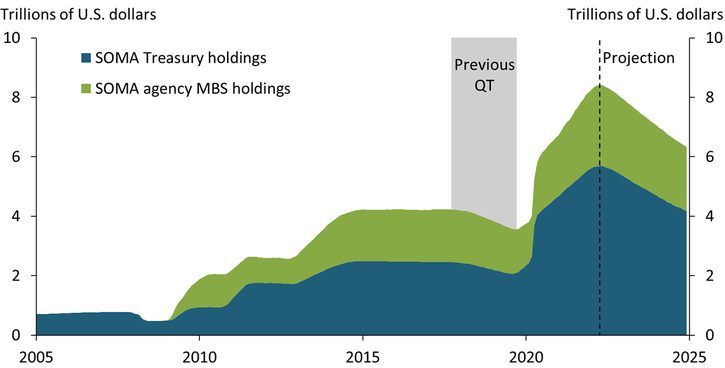
Note: Projections shown are based on Logan (2022).
Sources: Board of Governors of the Federal Reserve System (Haver Analytics
In June, the FOMC began reducing the size of the balance sheet through quantitative tightening (QT) by allowing maturing securities to “run off” the balance sheet rather than be reinvested. The current strategy for QT is rooted in the FOMC’s previous QT endeavor. From 2017 to 2019, the FOMC reduced its bond holdings by roughly $650 billion by allowing up to $50 billion in principle payments from maturing securities to run off its balance sheet each month (gray bar in Chart 1). Against a backdrop of relative calm, the 2017–19 runoff tightened financial conditions only modestly (Smith and Valcarcel 2021).
The FOMC’s plan for the current QT episode is for a faster and larger reduction in asset holdings relative to the 2017 QT episode. By September 2022, the FOMC will allow up to $60 billion of Treasuries and $35 billion of agency debt and MBS securities to run off the balance sheet each month. Based on projections from Logan (2022), Chart 1 shows that more than $2 trillion in asset holdings are projected to run off the balance sheet over the next few years._ In addition to the unprecedented size and pace of the runoff, the FOMC is embarking upon QT at a time when financial markets are unsettled, suggesting the outcomes of the 2022 and 2017 QT episodes may differ.
To assess whether this episode of QT might play out differently, we evaluate market conditions ahead of QT along three dimensions: the state of the U.S. Treasury market, monetary policy uncertainty, and the balance sheet positions of potential investor types. Chart 2 shows that U.S. Treasury markets are more volatile today relative to 2017. The blue line in Chart 2 shows that the MOVE index, a measure of future volatility in Treasury rates, increased from an average of 51 basis points in 2017 to an average of 116 basis points in May 2022._ Contextually, the June 2022 level of the MOVE index is slightly above its levels in March 2020 and well above levels observed during the 2013 “taper tantrum.” The green line in Chart 2 shows that liquidity measures such as bid-ask spreads for Treasury bills are also unusually elevated relative to 2017 and comparable to levels witnessed at the onset of the pandemic.
Chart 2: The U.S. Treasury market is much more unsettled ahead of QT compared with 2017
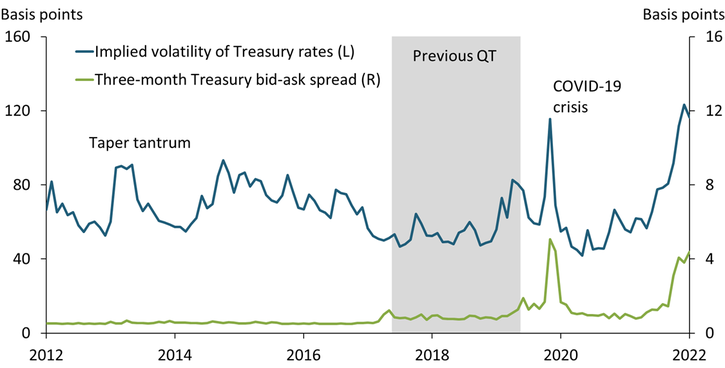
Note: Chart shows monthly average of daily values.
Sources: Bank of America/Merrill Lynch (Haver Analytics) and Bloomberg LP.
Significant uncertainty about the future path of the federal funds rate underlies the strains in the Treasury market. The green and blue lines in Chart 3 show measures of uncertainty about one-year-ahead interest rates ahead of each QT episode. The green line shows that interest rate uncertainty was relatively low leading up to the start of QT in October 2017, a time when the FOMC was pursuing a well-telegraphed path of gradual interest rate increases. In contrast, the blue line shows that uncertainty soared leading into June 2022, as the FOMC has rapidly increased the target federal funds rate by 150 basis points since March and recent projections from the FOMC’s Summary of Economic Projections convey a wide range for future rate increases.
Chart 3: Uncertainty about future policy rates is unusually elevated ahead of QT compared with 2017
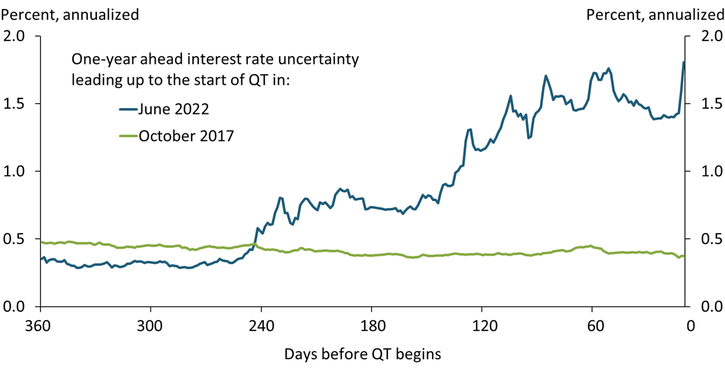
Note: Interest rate uncertainty is measured using options on Eurodollar futures.
Sources: CME Group and Bundick, Herriford, and Smith (2022).
In addition, some investor types have limited scope to purchase newly issued SOMA-eligible securities as the Federal Reserve reduces its balance sheet. During 2020–21, the Federal Reserve purchased more than half of the increase in outstanding SOMA-eligible securities._ With outstanding volume still increasing and the Federal Reserve withdrawing as the principal buyer, non-Fed investors will have to significantly increase their holdings. The orange diamonds in Chart 4 show the maximum share of SOMA-eligible securities held by each investor type since 2000—a realized benchmark for their maximum balance sheet absorption capacity—along with their shares in 2017 and 2022. The distance between the bars and diamonds indicates the capacity of those investors to increase their holdings.
Chart 4: Some investor types have limited capacity to absorb newly issued SOMA-eligible securities
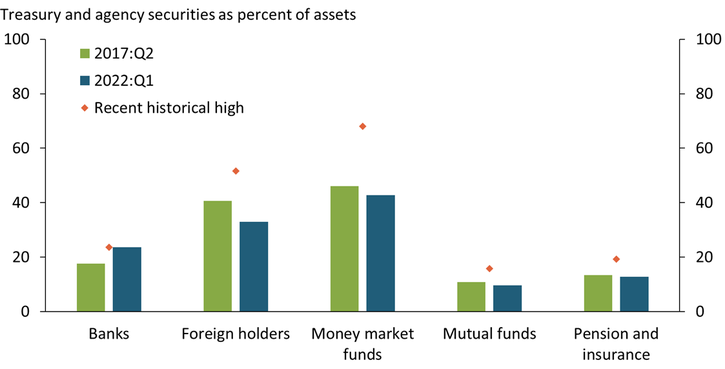
Notes: Orange diamonds show the historical high since 2000. The “foreign holders” category measures the share of current holdings of SOMA-eligible securities in all U.S. securities.
Sources: Board of Governors of the Federal Reserve System and U.S. Department of the Treasury (Haver Analytics).
Chart 4 shows that foreign holders and money market funds (MMFs) may be able to absorb some additional SOMA-eligible securities, though the scope is likely limited. Foreign holders’ share of outstanding SOMA-eligible securities has been declining since the global financial crisis. Although higher yields on U.S. Treasuries have historically proven attractive in times of global turmoil, recent geopolitical tensions may reduce this share even further (Noeth and Sengupta 2010). Similarly, MMFs are required to only hold securities of short maturities, which limits the scope of assets they can absorb. Moreover, the heightened policy uncertainty facing yields of short maturities may prompt MMFs to adopt a more cautious approach. MMFs have significantly increased their use of the Overnight Reverse Repo (ONRRP) facility from 2017, reflecting in part the uncertainty of investing in short maturities.
In contrast, banks, mutual funds, pension funds, and insurance companies are already holding shares of SOMA-eligible securities at or near historic highs, indicating their balance sheet capacity is low. Banks have recorded substantial mark-to-market (unrealized) losses on these securities amid rate increases in 2022, further disincentivizing additional purchases._ While unrealized losses reduce regulatory capital for the largest banks, they also pose challenges for small banks that seek to reposition their balance sheets and increase lending. Mutual funds, pension funds, and insurance companies are better positioned to hold these securities because they tend to hold debt to maturity, minimize interest rate risk by hedging, and benefit from higher yields. In addition, if these nonbank investors use deposits to buy newly issued SOMA-eligible securities, bank deposits will decline, giving banks relief on their (regulatory) leverage ratios._ However, the share of SOMA-eligible securities on the balance sheets of mutual funds, pension funds, and insurance companies are near recent maximums, suggesting yields may have to rise significantly to entice long-term investors to absorb forthcoming supply.
The contrast between the currently unsettled state of market conditions and the tranquil conditions that prevailed in 2017 suggests that this QT episode has the potential to be more disruptive compared with the benign start to the 2017 runoff. This risk rationalizes the FOMC’s initially gradual approach to QT, especially as markets absorb the recent rapid adjustments in interest rates.
Endnotes
-
1
The runoff rate in principal payments on agency MBS tends to decrease with rate increases (Logan, 2022).
-
2
The MOVE Index tracks the changes in the volatility of U.S. Treasury yields implied by current prices of one-month over-the-counter options on two-year, five-year, 10-year and 30-year Treasuries.
-
3
During 2020–21, outstanding SOMA-eligible securities increased from $29 trillion to $36.4 trillion. The Federal Reserve’s share of these securities increased from 13.8 percent to an unprecedented 24 percent.
-
4
As rates increase, unrealized losses at banks are likely to intensify further. More than 60 percent of bank SOMA-eligible securities are available for sale and an equal share have maturities greater than one year.
-
5
Supplementary leverage ratios for the eight systemically important banks fell as the Federal Reserve’s temporary relief measure for leverage exposure expired on April 1, 2021. If nonbank investors purchase securities using bank deposits, they can provide banks relief on their leverage ratios and thereby reduce balance sheet constraints.
References
Bundick, Brent, Trenton Herriford, and A. Lee Smith. 2022. “External LinkThe Term Structure of Monetary Policy Uncertainty.” Federal Reserve Bank of Kansas City, Research Working Paper no. 22-02, February.
Logan, Lorie K., 2022. “External LinkFederal Reserve Asset Purchases: The Pandemic Response and Considerations Ahead.” Speech at New York University’s Stern School of Business, March 2.
Noeth, Bryan J., and Rajdeep Sengupta. 2010. “External LinkFlight to Safety and U.S. Treasury Securities.” Federal Reserve Bank of St. Louis, Regional Economist, July 1.
Smith, A. Lee, and Victor J. Valcarcel. 2021. “External LinkThe Financial Market Effects of Unwinding the Federal Reserve’s Balance Sheet.” Federal Reserve Bank of Kansas City, Research Working Paper no. 20-23, December.
Rajdeep Sengupta is a senior economist at the Federal Reserve Bank of Kansas City. A. Lee Smith is a vice president and economist at the bank. Jacob Dice and Logan Hotz provided outstanding research and technical support. The views expressed are those of the authors and do not necessarily reflect the positions of the Federal Reserve Bank of Kansas City or the Federal Reserve System.