Warehousing grew substantially in Oklahoma over the past decade, especially in Oklahoma City and Tulsa. The industry’s employment more than doubled in the state since 2015, booming even more than the nation at the onset of the pandemic as consumers spent more on goods. In 2022, Americans began shifting their spending away from goods towards experiences, and warehousing growth moderated nationally and in the state. This edition of Oklahoma Economist examines changes in the warehousing industry considering these spending shocks, and the implications for real estate and workers in the industry.
Warehousing jobs soared in Oklahoma the past decade, especially during the pandemic
Over the past decade, the Transportation, Warehousing, & Utilities sector has experienced the most employment growth of all the broad categories of industries for which timely state data are available. The sector’s jobs grew 3.5% annually from July 2015 to July 2019, and boomed at 6.3% annual growth from July 2019 to July 2022 before declining by 0.9% from July 2022 to July 2023 (Chart 1). The majority of the growth was due to expansion of the warehousing industry in Oklahoma and the U.S.. As mentioned in the third quarter 2019 External LinkOklahoma Economist, demand for warehousing grew from 2013 to 2018 as consumers began to shift to online shopping, but the sector’s employment in Oklahoma grew faster than the national average and became more concentrated than the nation (Wilkerson & Shupert 2019)_. The number of warehousing jobs has climbed from around 18,000 at its seasonal peak in December 2015 to nearly 40,000 in December 2022, a 115% increase (Chart 2). These employment gains accelerated during the pandemic, increasing 18% per year from 2019 to 2022 after 11% annual growth from 2015 to 2019 (Chart 3). Warehousing employment in the United States only grew by 13% from 2019 to 2022. Oklahoma’s central location at the intersection of three interstate highways—I-35, I-40, and I-44—and its relatively low cost of land and buildings position the state as a natural distribution center in the country. Thus, both national and state spending trends impact Oklahoma’s warehousing economy.
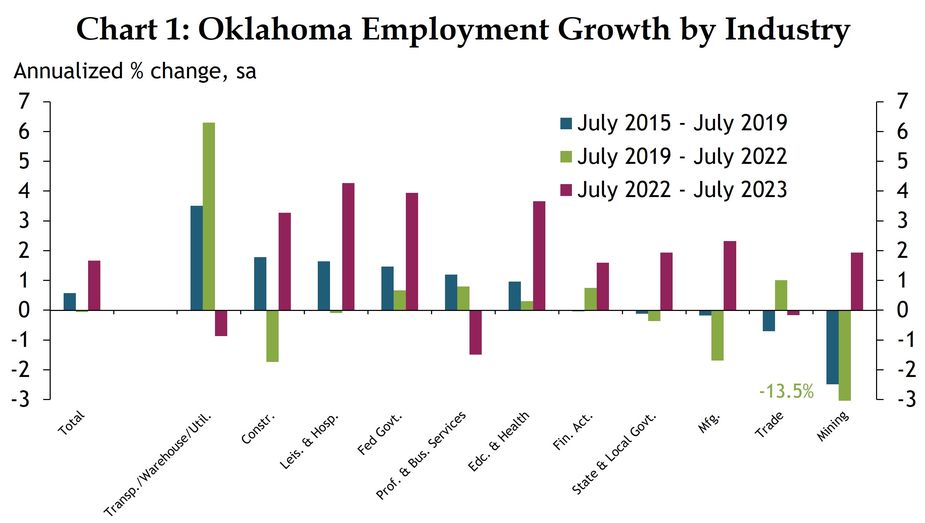
Notes: Professional and Business Services (Prof. & Bus. Services) includes Information. Trade includes Wholesale Trade and Retail Trade.
Source: BLS CES/Haver Analytics
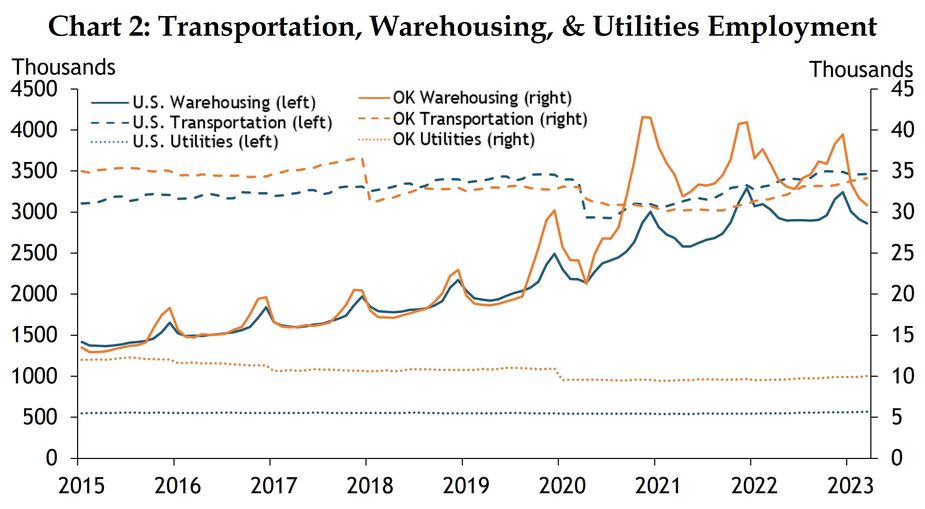
Note: Warehousing jobs are defined as all jobs in the NAICS 49 category, which include the private Postal Service (491), Messengers & Couriers (492), and Warehousing & Storage (493).
Source: BLS QCEW
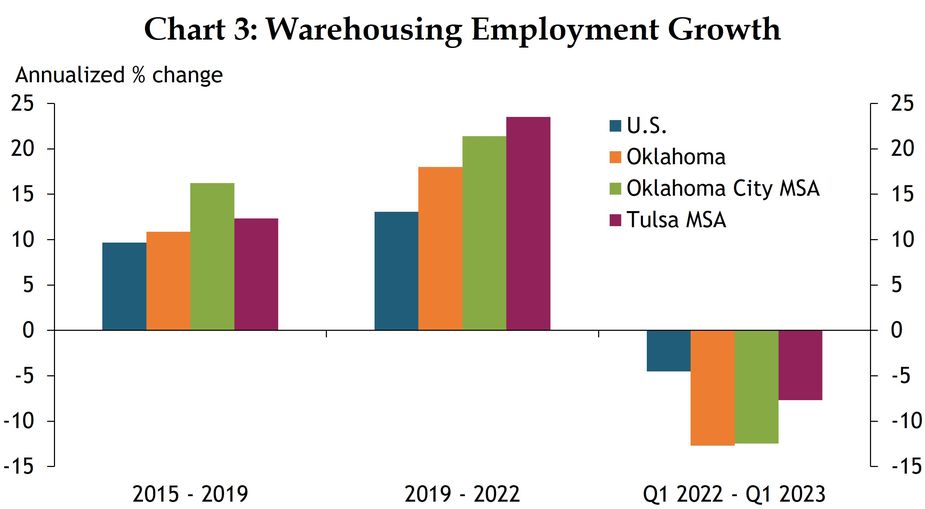
Source: BLS QCEW
Much of the recent boom in Oklahoma’s warehousing industry is in the Oklahoma City and Tulsa metropolitan areas. In both metros, the industry’s employment presence was about 3.5 times larger at the end of 2022 as it was in 2015. Tulsa’s employment boomed during the pandemic, increasing nearly 25% annually from 2019 to 2022 after growing by 12% each year from 2015 to 2019. Oklahoma City experienced steadier growth, rising 16% annually from 2015 to 2019 and 21% from 2019 to 2022.
This pandemic boom in the warehousing industry can likely be explained by consumer spending patterns at a national and state level. At the onset of the pandemic, the ability to spend money on in-person services and experiences was severely limited due to public health concerns. By May 2020, spending on experiences such as dining out or seeing a movie plummeted by nearly 70% compared with January 2020 in both the U.S. and Oklahoma (Chart 4). Consequently, many consumers shifted their spending toward durable goods and other retail items that can be used in their homes, increasing spending in these categories by as much as 20% by the summer of 2020, even as total spending fell by nearly 30%. This was even more pronounced in Oklahoma, where consumers spent 29% more on all durable goods, 63% more on home improvement, and 45% more on sporting goods and hobby merchandise (Charts 4 & 5).
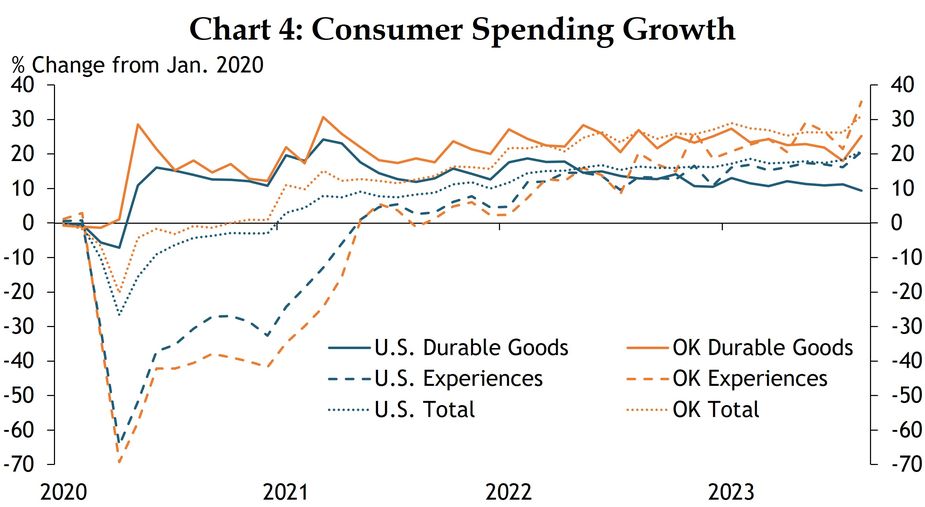
Note: Experiences consumer spending growth is calculated as an average of Accommodation & Food Service and Arts, Entertainment, & Recreation spending growth weighted by Personal Consumption Expenditures.
Sources: Affinity Solutions/Track the Recovery, BEA, authors’ calculations
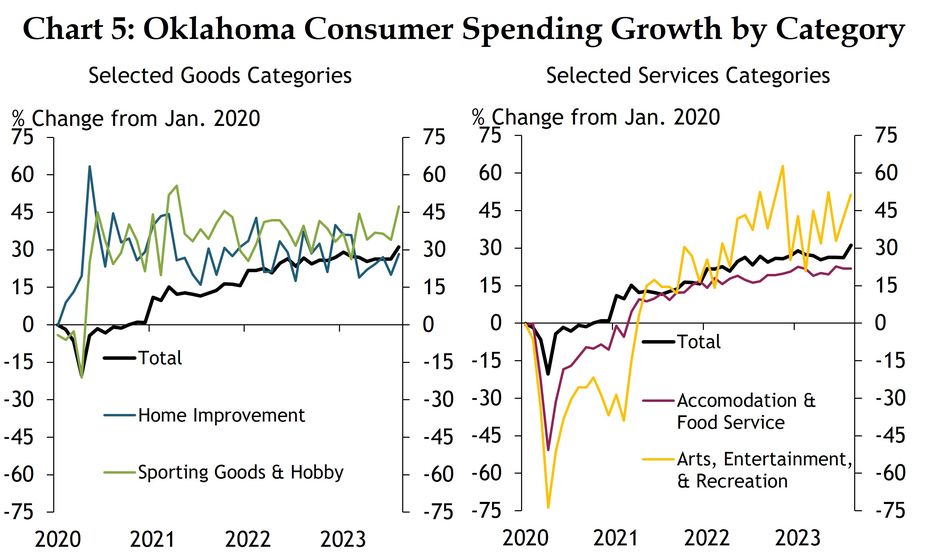
Source: Affinity Solutions/Track the Recovery
As the pandemic started to subside, consumer spending on experiences increased in 2022 while growth in durable goods held steady. These trends have continued, with spending on Arts, Entertainment, & Recreation in Oklahoma now 51% higher than pre-pandemic levels and Accommodation & Food Service spending 22% higher, while spending on durable goods remained around 25% higher than pre-pandemic levels. As a result, employment in the warehousing industry declined, more so in Oklahoma than the U.S. (Chart 3). The number of jobs in Oklahoma and the OKC metro fell by nearly 13% each from Q1 2022 to Q1 2023 and fell by nearly 8% in Tulsa, while the U.S. averaged only a 5% decline.
As demand increased, vacancy rates fell and rents accelerated, but have since leveled off
As the warehousing industry grew over the past decade, the occupancy of available warehouse space rose steadily and rent increases accelerated. For most of the past few decades, warehouse rents in the U.S. stayed relatively constant around $5 to $6 per square foot, with slightly lower rates in Oklahoma (Chart 6). Around 2015, warehousing rents started increasing steadily due to falling vacancy rates as consumers started purchasing more goods online. At the beginning of 2015, the warehousing vacancy rate was nearly 10% for the country, 8% for Oklahoma City, and nearly 9% for Tulsa, not far from their historical averages (Chart 7). By the end of 2019 however, the U.S. rate had fallen by 2 percentage points, while Oklahoma City and Tulsa’s fell by 2.7 and 3.5 percentage points, respectively, pushing up rents.
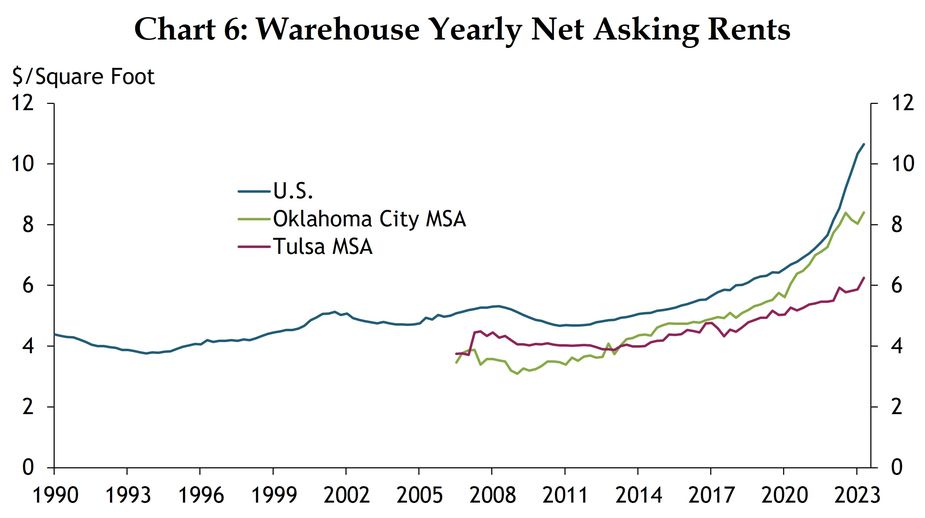
Source: CBRE-EA
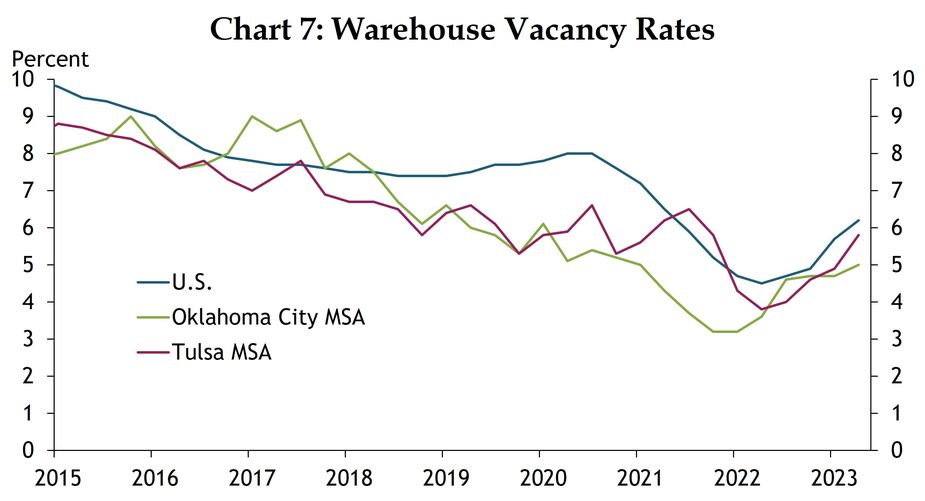
Source: CBRE-EA
The pandemic shock exacerbated these pre-existing trends as demand for online retail increased further and pushed vacancy rates to all-time lows. The effect was particularly pronounced in Oklahoma City, where the vacancy rate plunged by nearly 3 percentage points to 3.2% and rents grew by 10-15% year-over-year by the end of 2021. Tulsa’s rent increases largely tracked overall inflation during this time, as vacancy rates were slower to fall in the market, while U.S. rent hikes exceeded inflation by 3 to 6 percentage points through 2021, again due to lowered availability.
As demand for goods evened out and completions of new warehousing projects picked up in 2022, vacancy rates rose steadily, reaching 6.2% in the U.S., 5% in Oklahoma City, and 5.8% in Tulsa by Q2 2023. As a result, rent growth normalized in Oklahoma, falling back in line with historical increases of around 4-6%. However, as rent increases moderated in Oklahoma, rents in the U.S. continued to climb substantially, peaking at 28% annual growth at the end of 2022 before easing slightly to nearly 25% in Q2 2023. As such, warehouse rents in Oklahoma remain less expensive than the U.S. and local markets are slightly more balanced, ending Q2 2023 at $8.40 per square foot in Oklahoma City and $6.25 in Tulsa while the nation averages $10.65.
Warehousing jobs are highly seasonal with moderate pay, and may be at risk of automation
The warehousing boom created many new jobs in Oklahoma, but they remain highly seasonal. Employment picks up significantly toward the end of each year in preparation for a surge in holiday orders and recedes at the start of the next year (Chart 2). Additionally, compensation in the industry is not as high as many others in the state and has remained stagnant. The average weekly wage for a warehousing employee in Oklahoma was $763 in Q1 2023, approximately 32% less than the average wage in the state ($1,121). Similarly, the national average weekly wage for warehousing workers was $991 in Q1 2023, about 33% less than the average wage in the country ($1,487)_. Compensation has not increased as much in warehousing compared to the average across industries. The average weekly wage stayed flat or even declined from 2015 to 2021. Even after the industry’s pandemic boom, wages were only up by 10-15% relative to 2015 levels, while total wage growth across all industries in that period was around 30% in Oklahoma and 45% in the U.S. (Chart 8).
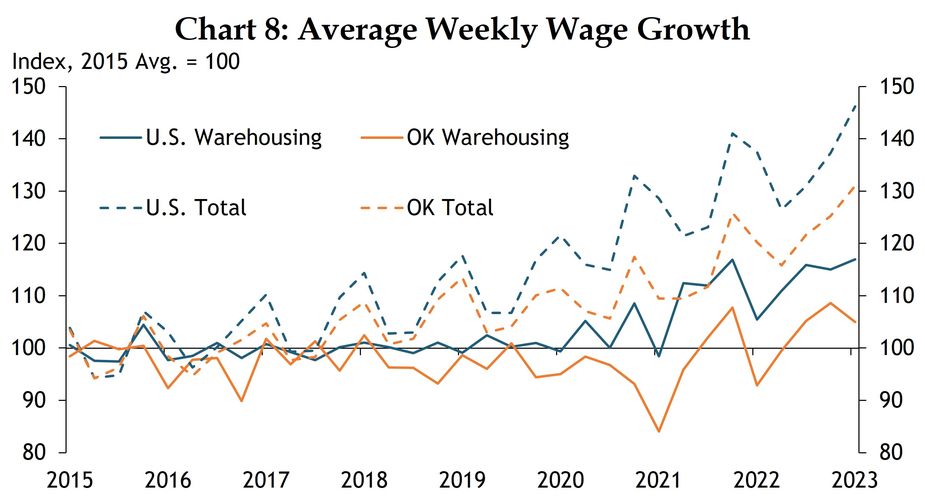
Note: Warehousing & Messengers average weekly wage is an average of the average weekly wage for Warehousing & Storage (493), Messengers & Couriers (492), and Postal Service (491) weighted by the number of employees.
Sources: BLS QCEW, authors’ calculations
In addition to less job stability due to seasonal trends, workers in the warehousing sector may face increased risk of automation in the future due to the proliferation of AI and other technologies. A recent study from the OECD surveyed 20 experts in AI and robotics on the degree of automatability of skills required for different occupations in OECD countries, given the existing technologies (Lassébie & Quintini 2022)_. The answers reveal that the experts rank Transportation and Material Moving as the fourth-most automatable occupation behind Construction and Extraction, Farming, Fishing, and Forestry, and Production, respectively (Chart 9). This poses a risk for job security in the warehousing sector, given that over 75% of all Oklahoma warehousing jobs are in Transportation and Material Moving, and that segment accounted for most of the pandemic employment gains in the industry. In 2022, Transportation and Material Moving workers comprised 28,850 of the 37,370 warehousing and messenger jobs in the state, while other highly automatable occupations only made up a small fraction (Chart 10).
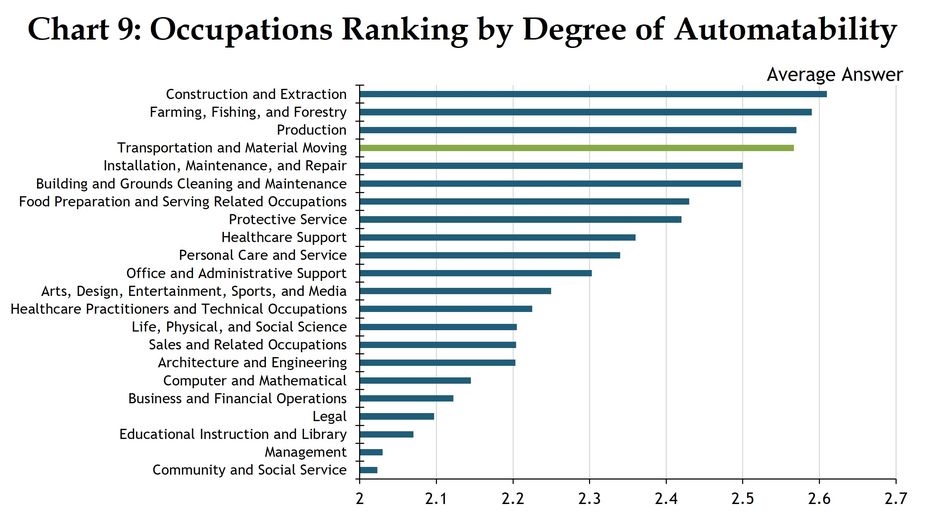
Notes: Values indicate the average answer to the question “Given current capabilities, would you say that the following skills or abilities can be automated?” where a value of 2 represents the answer “Yes, in some contexts” and 3 represents “Yes, in many contexts.” The average values shown are weighted by the relative importance of each skill surveyed for each occupation.
Source: Lassébie & Quintini (2022), OECD
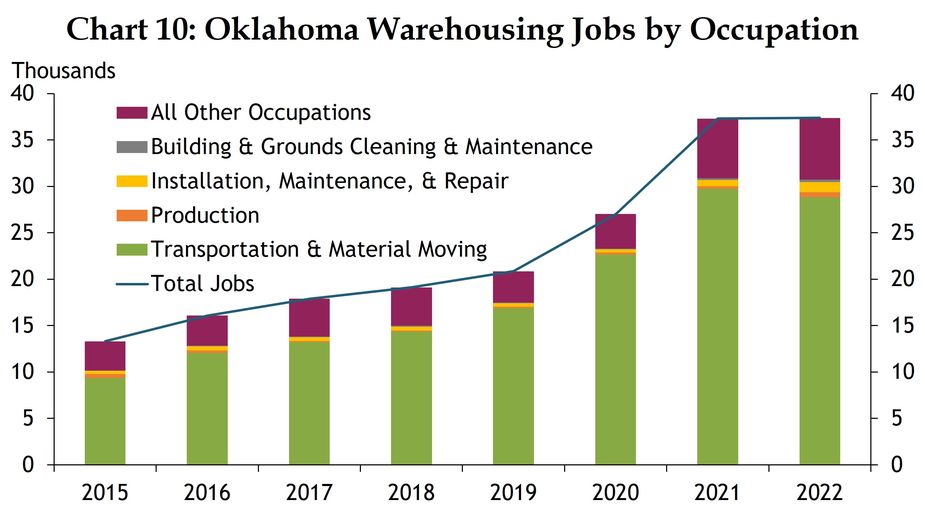
Source: BLS OEWS, authors’ calculations
Summary and Conclusions
The Covid-19 pandemic shock significantly altered the way Americans spend money, exacerbating an earlier trend among consumers toward online spending. Elevated spending on durable goods early in the pandemic propelled an already fast-growing demand for warehousing space and employees, particularly in the centrally located state of Oklahoma. This caused substantial employment gains for Oklahomans during a time of generally weak overall employment, and made the state’s warehousing real estate scarce, driving up rents. As consumers began spending more time and money on experiences the past couple of years, demand for goods leveled off, and warehousing rents and employment gains in Oklahoma moderated. While the warehousing sector enjoyed much growth in the state the past decade, the outlook for activity and employment in the industry is murky as automation and shifts in spending take hold in a post-pandemic economy.
Endnotes
-
1
External Linkhttps://www.kansascityfed.org/oklahomacity/oklahoma-economist/2019q3-job-growth-lagged
-
2
Wages are calculated as an average of the average weekly wage for Warehousing & Storage (493), Messengers & Couriers (492), and private Postal Service (491) weighted by the number of employees.
- 3