Over the past decade, Oklahoma GDP growth averaged 1.5% per year, somewhat less than the 2.1% national growth rate. However, large fluctuations in the state’s important energy sector played a significant role, and some places in Oklahoma have outpaced the nation. This edition of the Oklahoma Economist investigates GDP trends across the state during three distinct time frames: the oil boom years of 2011-15, the oil bust and sluggish growth of 2015-19, and the pandemic years of 2019-21. It finds that much of the state greatly outgrew the nation early in the period but has lagged since, and that the Oklahoma City metro area and a few micropolitan areas have experienced the fastest growth.
Larger places generally had faster GDP growth, energy a factor
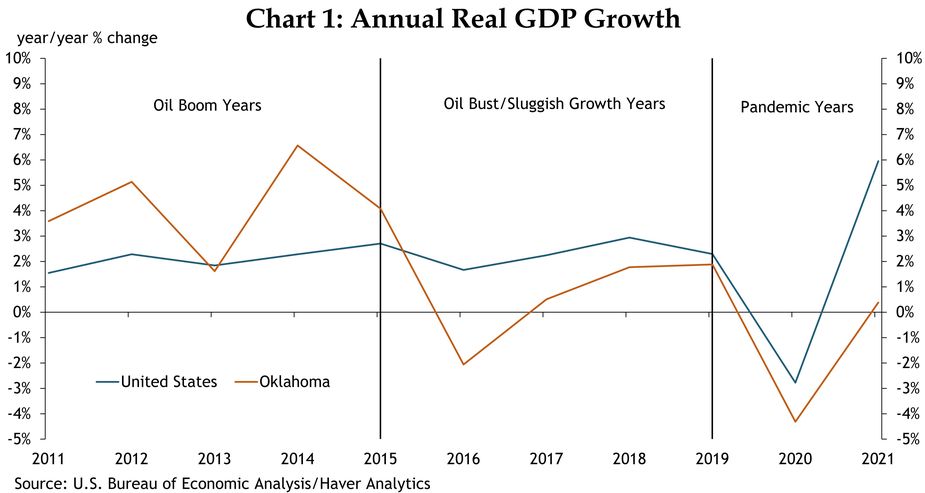
While the United States experienced steady annual GDP growth of around 2% from 2011 to 2019, Oklahoma’s growth was much more volatile, reaching 6.6% at the height of the oil boom and a low of -2.1% during the following bust (Chart 1). GDP data from the U.S. Bureau of Economic Analysis, just released at the county level for 2021 in December 2022, allows for a new examination of the output growth of regions and industries within the state during the past decade.
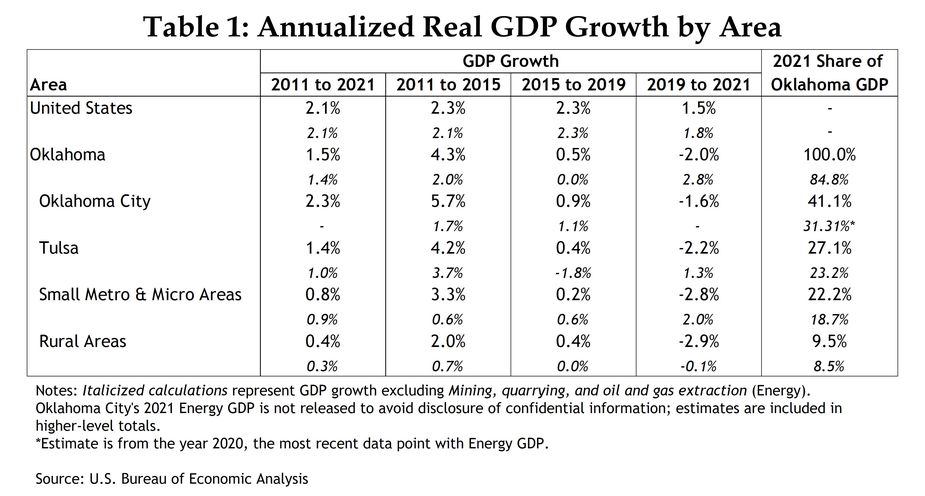
Overall, the more populous parts of Oklahoma grew faster than other areas of the state over the decade (Table 1). Oklahoma City and Tulsa metro area GDP—which together make up nearly 70% of Oklahoma’s total GDP—grew by an average of 2.3% and 1.4%, respectively, while smaller areas as a whole averaged yearly growth below 1%.
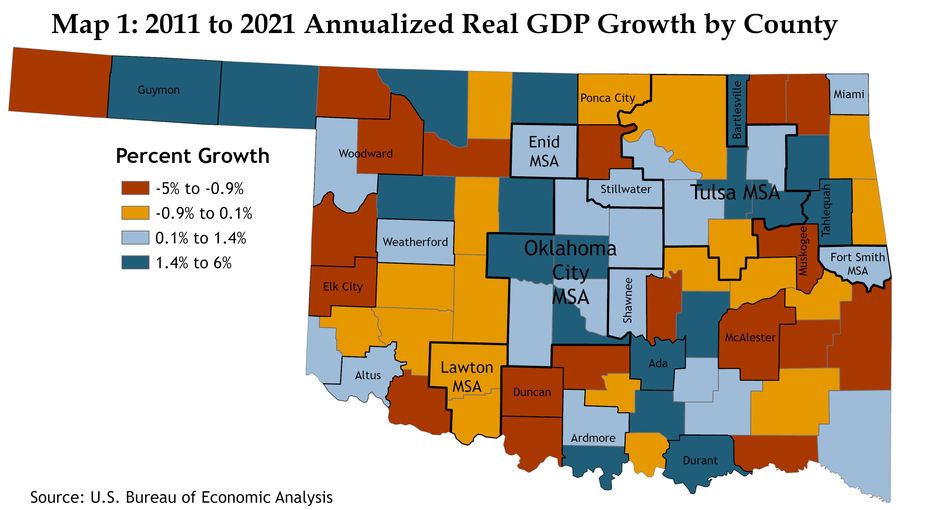
Both Oklahoma County and Tulsa County were in the top quartile for GDP growth in the state, and most counties on the periphery of the metropolitan areas were in the top one or two quartiles (Map 1). Simultaneously, many rural counties experienced flat or negative growth.
Oklahoma’s GDP growth continued to be influenced by the oil and gas sector. Energy contributed to approximately 15% of state GDP in 2020, while it only contributed to 2.6% of U.S. GDP. The state outperformed the nation during the oil boom years of 2011-15, averaging yearly growth of 4.3%, while state GDP only grew by 0.5% a year during the subsequent four years (Table 1). Without the energy sector, Oklahoma’s GDP growth would have been halved during the boom years, and Oklahoma City’s reduced by more than two-thirds. Similarly, Oklahoma City’s annual growth without energy would have been nearly a quarter of a percentage point higher on average during the bust.
In addition to the large metros, smaller metropolitan and micropolitan areas—comprised of Enid, Lawton, Fort Smith (Sequoyah County), and the micropolitan statistical areas—were also heavily reliant on energy, at least as a group. These areas enjoyed yearly growth of 3.3% during the boom years, but GDP declined by 2.8% annually during the pandemic, a time of low public energy demand. Non-energy production in these areas increased by around 2% in the same period, similar to the state as a whole. The pandemic-induced demand shock also affected the entire United States, as low energy production levels subtracted nearly a quarter of a percentage point from yearly national GDP growth.
Differential effects across Oklahoma areas, what industries driving?
The GDP location quotients of industries in different parts of Oklahoma can help explain some of the discrepancies in growth between metropolitan areas and smaller areas. _ Oklahoma was seven times more specialized in energy (Mining, quarrying, and oil and gas extraction) than the United States in 2021, and the Oklahoma energy sector grew 2.4% per year on average over the past decade (Table 2). During this time, Oklahoma City overtook small metropolitan and micropolitan areas for the highest energy specialization in the state, with a location quotient of 8.9 in 2020. Both the Oklahoma City and Tulsa metros’ specializations in energy increased significantly from 2011 to 2020, while the specialization in small metro and micro areas and rural areas stayed relatively constant. Thus, the growth of the energy industry partially contributes to Oklahoma City and Tulsa’s faster pace of growth.
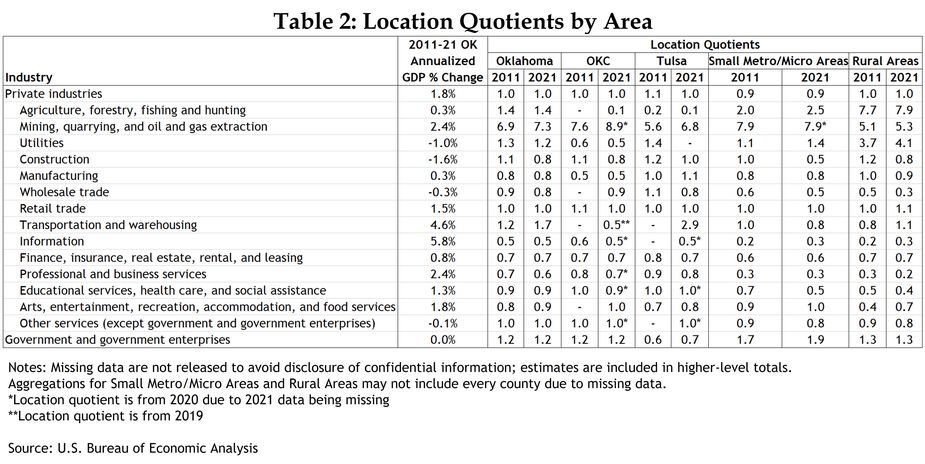
The large metro areas also have the largest location quotients in services industries, which saw the most growth over the decade. Tulsa has the largest specializations in Transportation and warehousing and Information, which both grew well above 4% annually. It also has the largest specialization in Professional and business services; Finance, insurance, real estate, rental, and leasing; and Educational services, health care, and social assistance, all of which experienced steady growth.
Key industries in Oklahoma’s micropolitan and rural economies declined over the decade, resulting in negative or sluggish growth for some communities. The Utilities industry—comprised of electricity generation, natural gas distribution, and water and sewage services—saw a 1.0% average annual decrease in GDP. Location quotients for this industry grew in micropolitan and rural areas over the decade, even as output fell, while the location quotient for the whole state decreased. In Oklahoma’s rural areas, Utilities’ location quotient increased from 3.7 in 2011 to 4.2 in 2021. Production in Agriculture, forestry, fishing, and hunting remained mostly flat, with an average annual growth rate of 0.3%. This industry is also heavily concentrated in Oklahoma’s rural communities. Rural areas are nearly six times as specialized in agriculture and its related industries as the state as a whole, and nearly eight times as specialized as the nation.
Some smaller areas have grown fastest of all, what characterizes them?
Even as less populous areas in Oklahoma saw relatively sluggish growth in aggregate over the decade, some micropolitan areas have grown similarly to—and in some cases much faster than—the state and the nation. Specifically, the Guymon, Bartlesville, and Durant micropolitan areas all average annual GDP growth over 3.9%, and Ada, Tahlequah, and Shawnee all grew by at least 1.4% on average (Table 3).
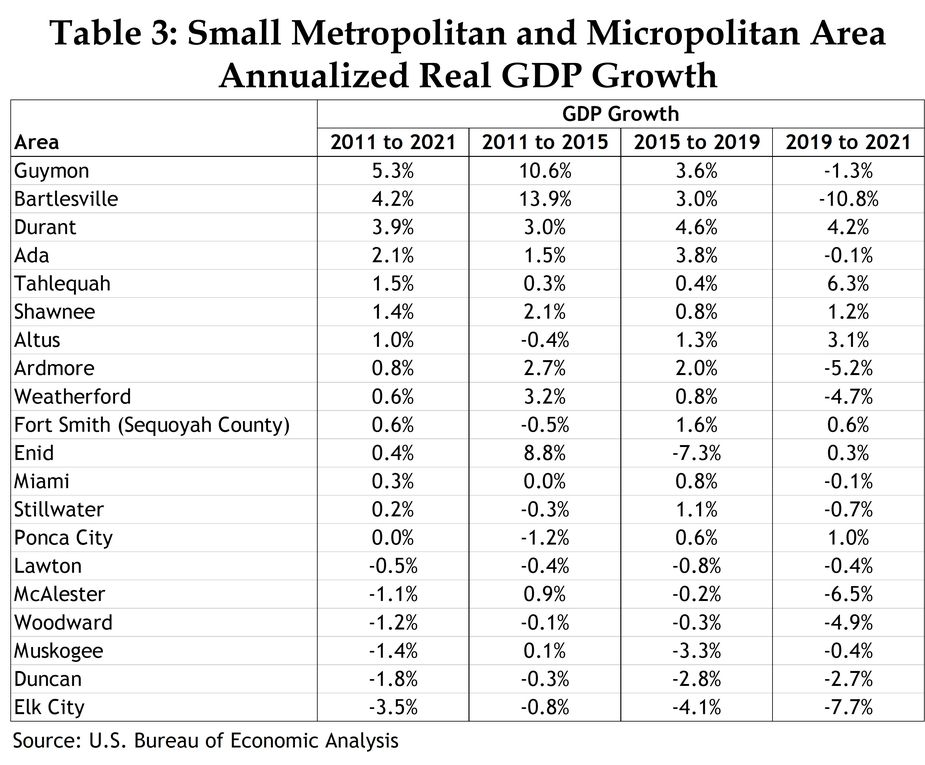
Each of these six micropolitan areas with the most increase in GDP have a heavy concentration in particular industries which likely helped propel the growth. Guymon grew the fastest of any area in Oklahoma and outpaced the nation, growing at 5.3% on average from 2011 to 2021. Guymon’s economy is largely defined by the agriculture industry. Its agriculture location quotient was 31.2 in 2011 and grew to 35.1 in 2021 (Table 4). Guymon saw the fastest growth during the oil boom years—also solid years for agriculture—with GDP increasing by 10.6% on average from 2011 to 2015, but also posted 3.6% annual growth in the following four years.
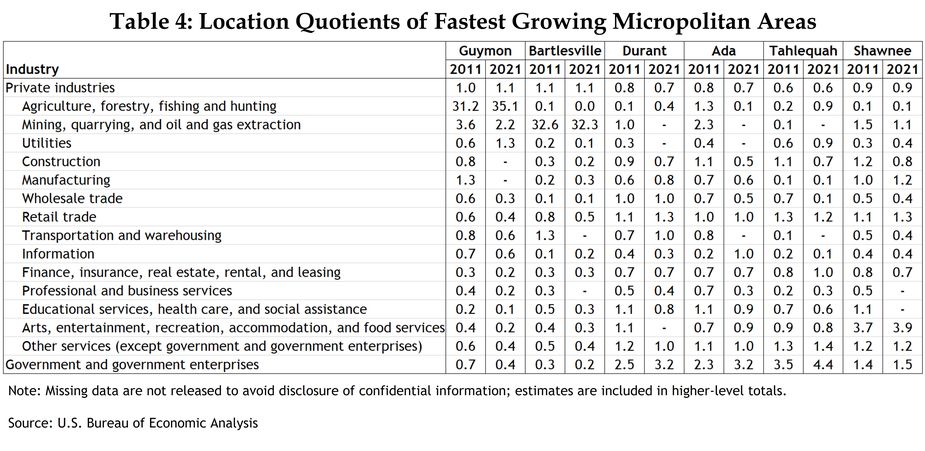
Second to Guymon in growth was Bartlesville, increasing GDP by 4.2% a year on average during the decade. Like Guymon, Bartlesville’s GDP increased the most in the oil boom years. The economy grew 13.9% yearly during this time, the highest annual rate of anywhere in the state. Also similar to Guymon, the Bartlesville economy has one primary industry in which it is heavily concentrated, namely oil and gas. Bartlesville was nearly five times more specialized in energy GDP than the state at the start of the oil boom, with a location quotient of 32.6. Bartlesville’s economic growth largely follows the trends of the oil and gas industry. It experienced a much more modest 3.0% annual growth rate during the oil bust years, and the area’s output fell by 10.8% yearly from 2019 to 2021 as energy demand dropped during the pandemic
Several micropolitan areas with large tribal presences also had solid growth in GDP over the decade and actually grew the most during the state’s more sluggish years. Durant, headquarters of the Choctaw Nation, outpaced the state and nation from 2011 to 2021, and Ada, Tahlequah, and Shawnee—headquarters of the Chickasaw, Cherokee, and Citizen Potawatomi Nations, respectively—grew steadily as well. Unlike Guymon and Bartlesville, Durant and Ada grew the most in the years following the oil boom. Durant and Tahlequah also grew considerably during the pandemic years. Tahlequah averaged a yearly growth rate of 6.3% during the pandemic, the largest growth of any area in the state. Ada sustained relatively constant GDP when the state and many other micropolitan areas experienced a decline. Shawnee saw the most consistent growth over the decade, ranging from an annualized rate of 0.8% from 2015-19 to 2.1% in 2011-15. All these areas are highly specialized in Government and government enterprises, which includes tribal activity. The location quotients in this category increased in each of these places from 2011 to 2021.
Unlike most other micropolitan and rural areas in the state, these tribal headquarters micropolitan areas also have a higher concentration in services, which grew at a faster pace than goods. Shawnee was nearly four times as specialized than the nation in Arts, entertainment, recreation, accommodation, and food services in 2021, which includes casinos and hotels, and Durant was slightly more specialized in it in 2011. Durant, Ada, and Shawnee also specialize in Educational services, health care, and social assistance, which may also be related to tribal activity. Durant, Ada, Tahlequah, and Shawnee all specialize in Retail Trade and Other Services. By contrast to most smaller areas in the state, these areas have little specialization in the industries that weakened the most over the decade, like Utilities and Construction. Their higher concentrations in services and the growth in tribal activity allowed these areas to avoid the declines that much of the state experienced during the oil bust and pandemic years.
Summary and Conclusions
While Oklahoma’s GDP growth averaged 1.5% annually from 2011 to 2021, there were noteworthy differences by time period and region. After strong growth during the oil boom years of 2011 to 2015, the state underwent periods of sluggish growth and declining GDP due to the oil bust and Covid-19 pandemic. Overall, the Oklahoma City and Tulsa metro areas experienced a faster pace of growth than smaller areas, due largely to their greater specialization in the energy and services sectors, which grew the most over the decade. High growth in some smaller micropolitan areas was driven by key industries in each area that either experienced a boom or insulated them from large declines during the turbulent bust and pandemic years. Heading forward, there may be continued divergence in growth trends across the state as energy production sources evolve and service sectors in more densely populated areas continue to grow in a post-pandemic economy.
Endnotes
-
1
A location quotient is a ratio of ratios which shows how sizable or specialized an industry is in a certain location relative to a larger location. In this case, the numerator is the GDP of an industry in an area of Oklahoma over the total GDP of that area, and the denominator is the GDP of that industry in the United States over total U.S. GDP. So, a location quotient greater than 1 shows that the area has a relatively larger presence of that industry than the United States.