In the past, large declines in oil prices have had negative effects on Oklahoma's economy. This especially has been true when the state's oil and gas sector is large, as it is now. Each past episode, however, has been unique. This edition of The Oklahoma Economist compares the current large decline in oil prices with past episodes to determine potential effects on the Oklahoma economy in 2015.
Economic effect on Oklahoma of past oil price declines
Since 1980, there have been six other large declines in oil prices (defined as inflation-adjusted oil prices falling nearly continually by more than 30 percent and more than $20 a barrel). These declines occurred twice in each of the 1980s, 1990s and 2000s (Chart 1). Although each previous episode was unique, each was accompanied by a subsequent decline in at least one indicator of Oklahoma economic activity; in most cases several other indicators also fell.
Chart 1. Large Real Oil Price Declines, 1980-present
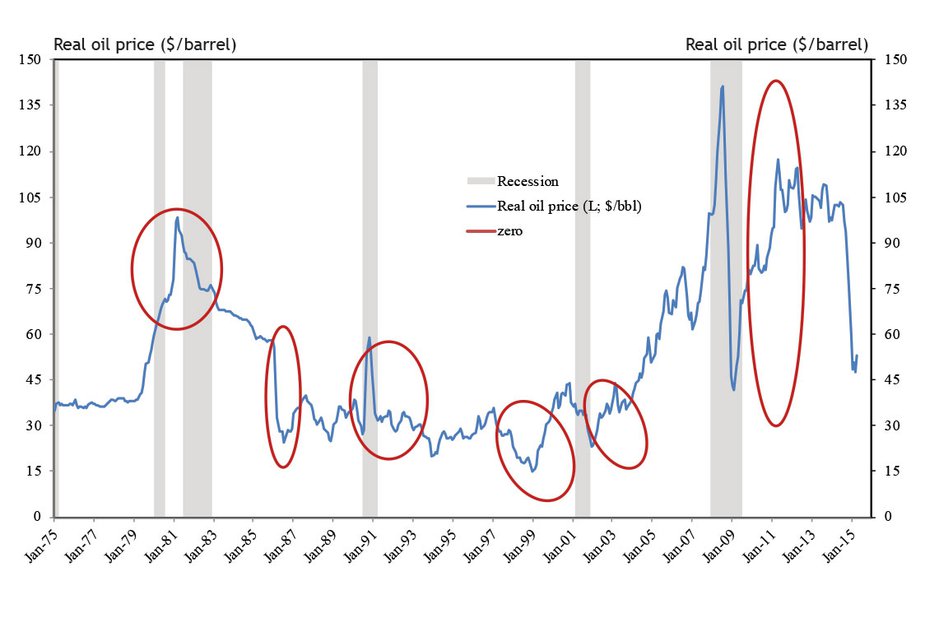
Source: EIA, NBER
In each previous decline, employment in the mining sector (almost exclusively oil and gas employment in Oklahoma) declined significantly in the year after the decline (Chart 2). The one-year decline in Oklahoma mining jobs has been at least 7 percent in each episode and was almost 20 percent in 1985-86.
In five of the six previous cases, state sales and gross receipts tax collections—a proxy for consumer spending in the state—also fell in the following year, after adjusting for inflation. The exception was in 1997-98. Oklahoma consumption taxes also fell only slightly in the 2000-01 episode, but fell by more than 7 percent in every other instance.
In four of the previous downturns, overall Oklahoma employment also fell and total employment remained below its previous peak for at least three years. The two exceptions were in 1990-91 and 1997-98, after which total Oklahoma employment was actually about 5 percent higher three years later. Otherwise, total Oklahoma employment fell by more than 1 percent and by as much as 3.6 percent in the year after the price decline and was still as much as 2.4 percent below its peak three years later.
Based just on these past basic relationships between oil prices and Oklahoma economic activity, it seems likely that mining employment in the state will decline significantly in 2015. Indeed, layoffs in that sector have already been announced in early 2015. But the state may also face overall declines in consumer spending and employment. Understanding the circumstances of past declines in oil prices may help shed light on the likelihood and severity of a broader economic impact in 2015.
Chart 2. Oklahoma Employment and Sales Tax Receipts Change
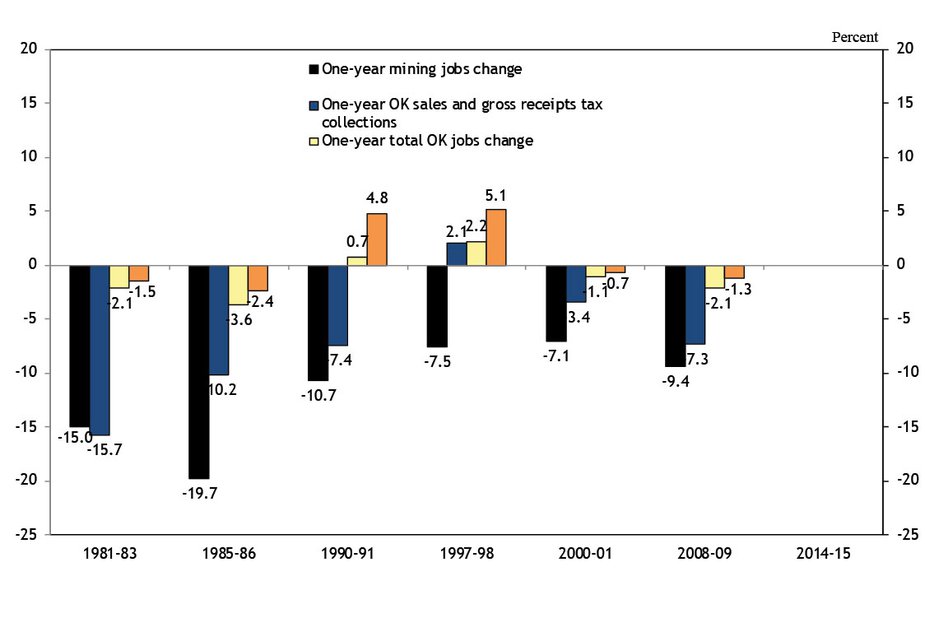
Source: U.S. Bureau of Economic Analysis, State of Oklahoma
Oklahoma's unique circumstances in previous downturns
There are a couple of Oklahoma-specific factors that distinguish previous periods of declining oil prices. One is the size of the state's oil and gas sector. Another is the economic conditions in the state just prior to a decline in oil prices.
The size of Oklahoma's oil and gas sector has fluctuated over the past 35 years. Prior to the decline in oil prices in 1981, the mining sector accounted for more than 9 percent of Oklahoma employment and almost 13 percent of Oklahomans' personal earnings (Chart 3). By the late 1990s, the sector (which again is almost exclusively oil and gas employment in Oklahoma) had shrunk by two-thirds. During the 2000s, the trend reversed and the sector grew rapidly. By the eve of the 2008-09 financial crisis, the sector was actually larger in terms of its share of Oklahoma worker earnings than in 1981; its share of employment though was still considerably smaller, as average pay in the industry increased significantly. The sector was again robust in 2014, accounting for more than 6 percent of Oklahoma employment and nearly 13 percent of Oklahoma workers' earnings.
The effect of declines in oil prices on Oklahoma's overall economy has clearly, and perhaps not surprisingly, been more significant when the mining sector is large. Specifically, total Oklahoma employment fell more than 2 percent following the episodes of 1981-83, 1985-86 and 2008-09, when the mining sector was at its largest (and similar to its current size). At the same time, consumer spending also fell sharply. By contrast, overall Oklahoma employment fell much less or even rose slightly in the other episodes, when the sector was smaller.
Economic conditions in Oklahoma prior to oil price declines have also varied since 1980. For example, unemployment was less than 4 percent just prior to three of the previous oil price downturns, but was much higher just ahead of the 1985-86 and 1990-91 downturns. As such, the timing of the large decline in Oklahoma employment following the 1985-86 episode was harder on the state than the large job declines of 1981-83 and 2008-09. Fortunately, the unemployment rate in Oklahoma in mid-2014 of about 4.5 percent was closer to the latter two cases than to 1985-86.
Chart 3. Oklahoma Mining Sector Size and Unemployment Rate
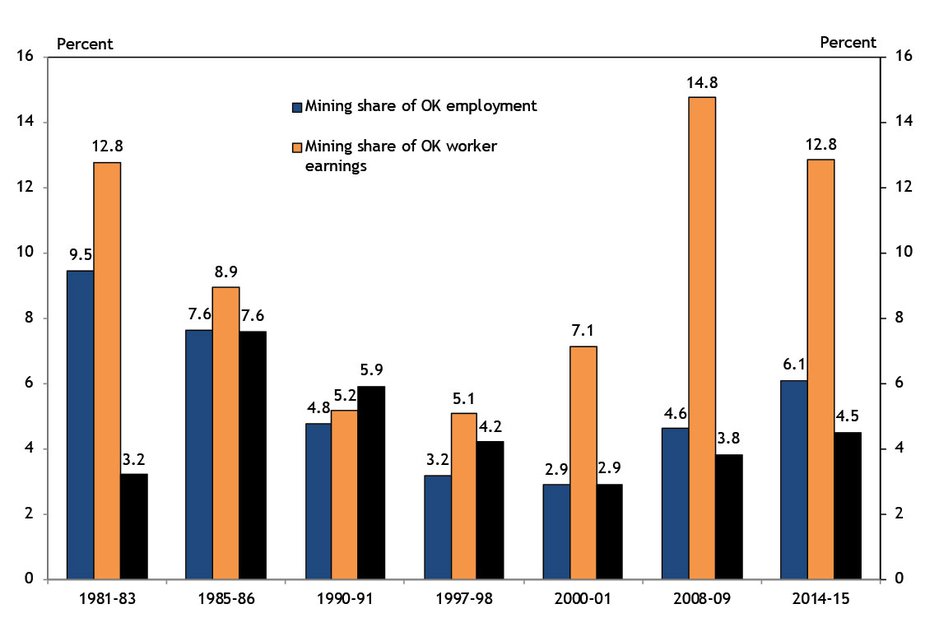
Source: U.S. Bureau of Economic Analysis, U.S. Bureau of Labor Statistics
Other unique circumstances of previous oil price declines
In addition to differing circumstances in Oklahoma, the context of each of the six previous oil price declines also differs in other ways. These include the speed of the drop in oil prices, the path of oil prices prior to the decline, the state of the national economy and the duration of low oil prices (Table 1). Comparing the current episode using these factors may provide further insight on the outlook for 2015.
Table 1. Other Circumstances of Large Real Oil Price Declines, 1980-present
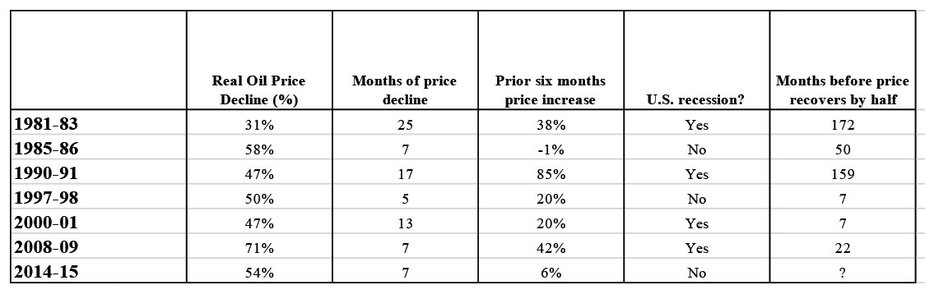
Source: EIA, NBER, Author calculations
The speed at which oil prices declined was much faster in half of the previous episodes. Specifically, the decline happened over seven months or less in 1985-86, 1990-91 and 2008-09, suggesting the oil sector was hit by a sizable shock. This is similar to the current case, in which prices fell more than 50 percent in just seven months. By contrast, the price declines in the other periods took longer—over a year in each case, and over two years in 1981-83. The most similar shock to the current situation was 1985-86, when the dynamics of world oil supplies experienced an unexpected change. Specifically, OPEC leader Saudi Arabia, faced with falling oil prices, reversed its decision to cut oil production and actually increased production, pushing prices further down. OPEC made a similar decision in the second half of 2014. In 1990-91, the Gulf War caused both a spike and then a quick decline in oil prices. In 2008-09, a worldwide financial crisis reduced global demand for oil, sharply pushing prices down.
The path of oil prices in the months ahead of a decline also differs widely across past episodes. In one case—1990-91—oil prices almost doubled in the six months prior to the large decline. In four other cases, prices increased between 20 percent and 42 percent before falling. By contrast, in one case—1985-86—prices had been essentially unchanged over the previous six months. The current case is again most similar to the 1985-86 episode, although prices in the first half of 2014 showed a slight increase of about 6 percent.
The majority of previous large declines in oil prices occurred within the context of a U.S. recession. There were two exceptions: 1997-98, when financial crises in Asia and South America dampened world oil demand but did not result in a U.S. recession, and 1985-86, when a quick change in world oil supply conditions hurt oil prices but not the overall U.S. economy. The current episode is also occurring outside the context of U.S. recession and with some similar aspects of both previous exceptions—weaker economic activity in some areas of the world, and a decision by OPEC to maintain production in the face of falling oil prices.
Finally, the duration of past oil price declines has varied significantly. In the three large declines that occurred in the 1980s and early 1990s, prices recovered less than half of their loss (in inflation-adjusted terms) over the next four years. By contrast, in each of the three more recent instances, prices regained half of their decline in less than two years. During this time, the structure of the U.S. oil and gas industry changed, including how it is financed. National capital markets and banks now provide much of the funding for drilling projects, as opposed to small bank financing that was more common in the 1980s.
Although oil prices remain low in the current environment, some change appears likely. Both futures prices and forecasts from the Energy Information Administration call for moderate increases in oil prices by year-end 2015. Respondents to the Federal Reserve Bank of Kansas City's latest quarterly PDFenergy survey expressed a similar view, indicating they expect prices to rise to about $70 a barrel by year-end. One reason is the quick response of U.S. oil producers to the decline in oil prices, including sharp cuts in drilling activity and fast production decline rates from shale oil plays. This quicker response than in the past is expected to boost prices sometime in 2015.
Conclusion
Oklahoma is experiencing its seventh large decline in oil prices in the past 35 years. The circumstance of each downturn differs, but some past episodes are more similar than others to the current episode. In particular, the oil price decline of 1985-86, which hit the Oklahoma economy especially hard, has many similarities. That oil price decline also occurred very quickly and outside the context of a U.S. recession, and from a previous relatively stable oil price environment. The size of the Oklahoma oil and gas sector at that time was also similar to today’s, although employment in the sector was somewhat larger in 1985-86 and workers’ earnings were somewhat smaller.
A key difference between today and the 1985-86 episode is the state of the Oklahoma economy heading into the two oil price downturns. Unemployment was over 7.5 percent when oil prices began falling in 1985, whereas state unemployment in mid-2014 stood at just 4.5 percent. Another potential difference is that oil prices in the 1980s and early 1990s remained low for a protracted period, whereas oil prices have typically rebounded more quickly from price declines since the late 1990s. Such was the case in the most recent oil price decline, in 2008-09, which also has several other similarities to the current episode. The structure of the oil and gas sector in Oklahoma, in terms of its focus on shale plays where drilling can be adjusted quickly, and its greater reliance on national rather than local financing, is also more similar to recent episodes than to the downturns of the 1980s.