Demand for housing in Oklahoma and the nation surged following the Covid-19 pandemic. This further reduced historically low supply and pushed home values up significantly. More recently, prices have begun to normalize, but affordability has been squeezed by higher mortgage rates. Purchasing a new home in Oklahoma now costs considerably more than it did a few years ago. This edition of Oklahoma Economist examines recent housing price trends and finds that despite these sizable increases in costs, including in rural Oklahoma, housing in the state remains much more affordable than in the nation.
Elevated pandemic housing demand and tight supply accelerated price and rent growth
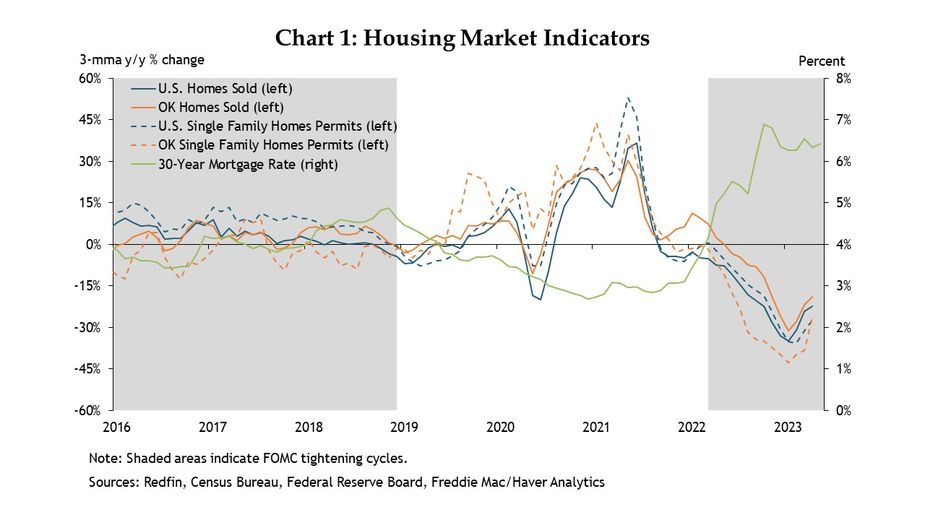
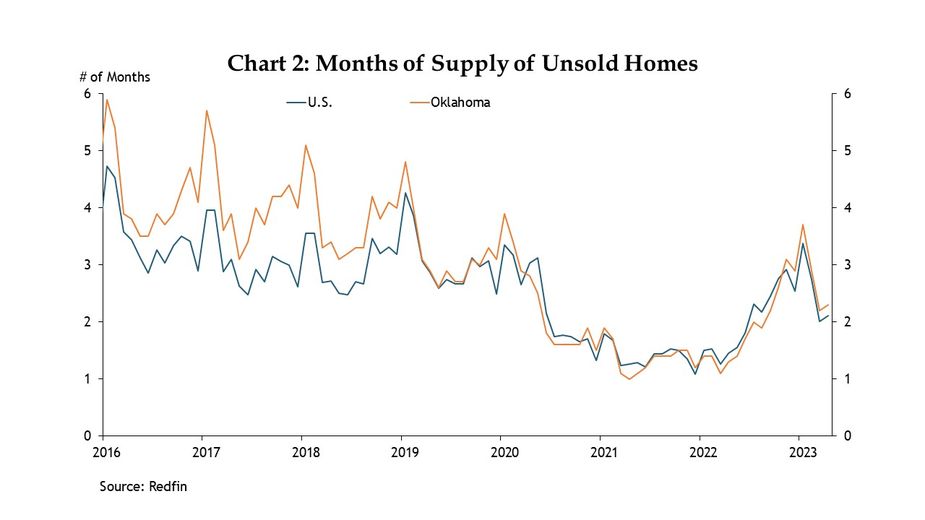
Not long after the onset of the Covid-19 pandemic, home sales, construction, and prices surged in Oklahoma, driven by low interest rates as well as elevated disposable incomes from stimulus payments and heightened demand as workers spent more time at home (Wilkerson and Shupert 2021)._ Home sales peaked in the summer of 2021 at 37% annual growth in the U.S. and 30% in Oklahoma (Chart 1). The surge in demand tightened housing supply from already depressed levels, reducing the months of supply of unsold homes in Oklahoma from four months in January 2020 to just one month by March 2021 (Chart 2)._
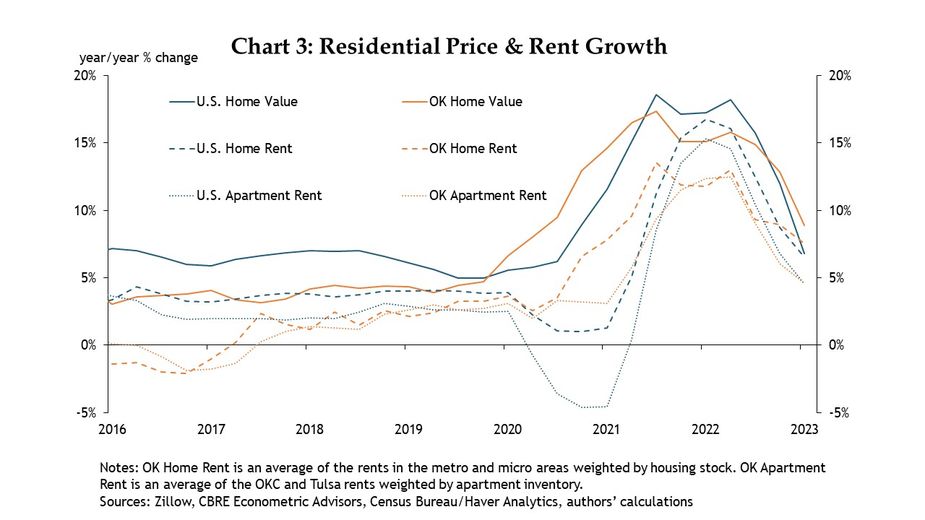
As a result, home values rose dramatically, and rents largely moved in parallel. Both the state and the nation sustained growth rates in home values of 14-20% year over year from Q2 2021 to Q2 2022 (Chart 3). State home rents also grew rapidly during this time, peaking at nearly 14% year over year change in Q3 2021. While apartment rents in the U.S. declined initially during the pandemic, rents in the Oklahoma City and Tulsa metro areas sustained annual growth of around 3-5% in 2020. These disparities in growth may be partially explained by the state’s higher personal income and consumer spending growth in 2020 (Wilkerson and Shupert 2021) as well as net domestic in-migration to Oklahoma from several states (Shupert and Wilkerson 2022)._
At its March 2022 meeting, the Federal Open Market Committee (FOMC) voted to raise the federal funds target rate, beginning a tightening cycle that has continued into 2023. Mortgage rates rose accordingly, from 4.2% in March 2022 to 6.4% in May 2023 on average, which in turn slowed demand for housing and caused supply to rebound somewhat in the U.S. and Oklahoma. Home value and rent growth has since begun to normalize as supply and demand have come a bit more into balance, but prices remain elevated.
Home prices in rural Oklahoma increased the most
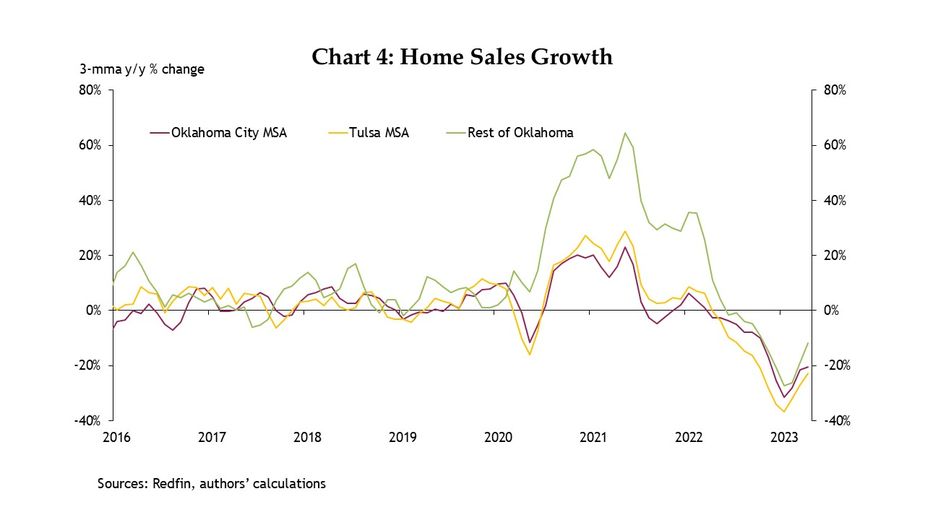
While home sales growth in the state as a whole largely matched the strong national trends during the pandemic, the smaller areas in Oklahoma experienced far greater increases during the demand surge. The Oklahoma City and Tulsa metro areas’ annual sales growth peaked in May 2021 at 23% and 29%, respectively, while home sales increased by 65% annually in the rest of the state (Chart 4).
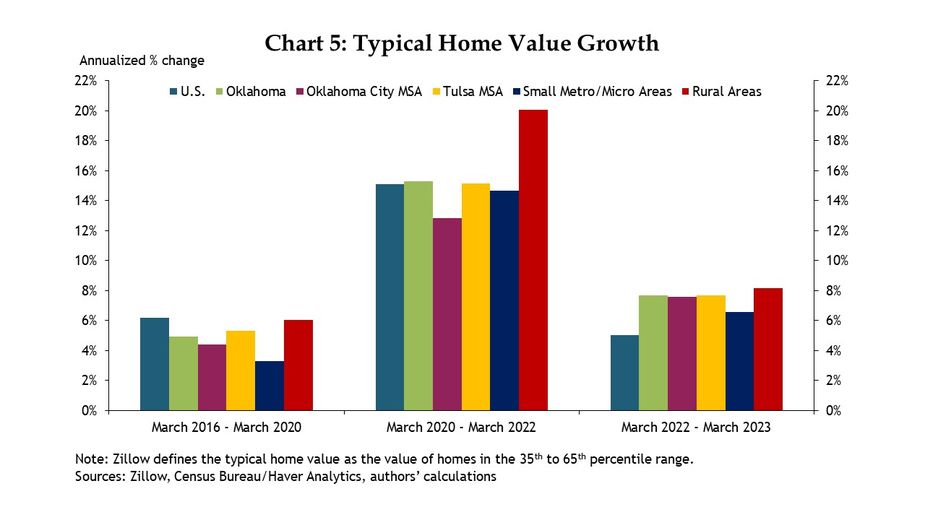
Outsized demand for housing in smaller areas in the state caused home values to spike even more than in the larger parts of Oklahoma. Before the pandemic, home values were growing less across Oklahoma than in the nation. Home values in the U.S. increased at an average annual rate of 6.2% from March 2016 to March 2020, while the state averaged a 4.9% annual rate (Chart 5)._ During the pandemic housing boom, home value growth in Oklahoma matched the nation, growing at around 15% annually from March 2020 to March 2022. Home values in rural areas grew even faster in the same period, at 20% each year. Even as demand eased over the past year, Oklahoma’s home values continued to grow more than the nation’s. The state, two large metros, and rural areas all grew around 8% year-over-year in March 2023. At the same time, U.S. growth fell to 5%, driven by declines in home values in the western part of the country._
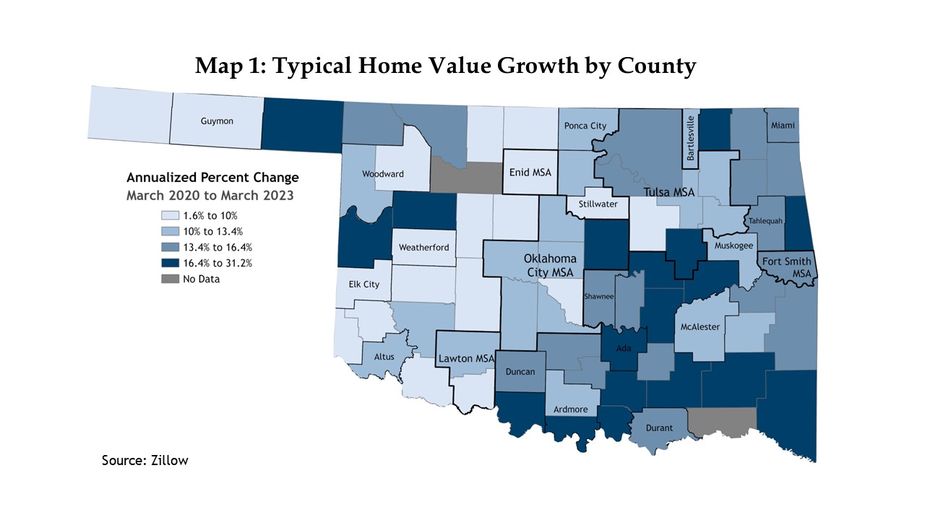
The largest increases in rural Oklahoma’s home values during the pandemic were mostly clustered in the scenic southeast corner of the state. Many counties in that region were in the top quartile of county home value growth, increasing by as much as 31% each year from March 2020 to March 2023 (Map 1). This growth could reflect continued urban sprawl into southern Oklahoma from the Dallas-Fort Worth metro, increased demand for recreational housing in scenic areas, and the ability to work remotely, among other factors. Several other areas in the eastern part of the state experienced strong home value growth. The Oklahoma City and Tulsa metros each had one exurban county in the top quartile: Lincoln County home prices grew by 20% yearly and Okmulgee County prices grew 18%. Home values in some neighboring counties to the Oklahoma City and Tulsa metropolitan areas—namely Hughes, McIntosh, Okfuskee, and Pontotoc counties—also grew by more than 16% each year. This trend may be a result of migration to the suburban periphery of metropolitan areas during the hybrid work revolution, as households were more willing to live farther from employers (Rappaport 2022)._
Despite high prices and rates, Oklahoma remains much more affordable than the nation
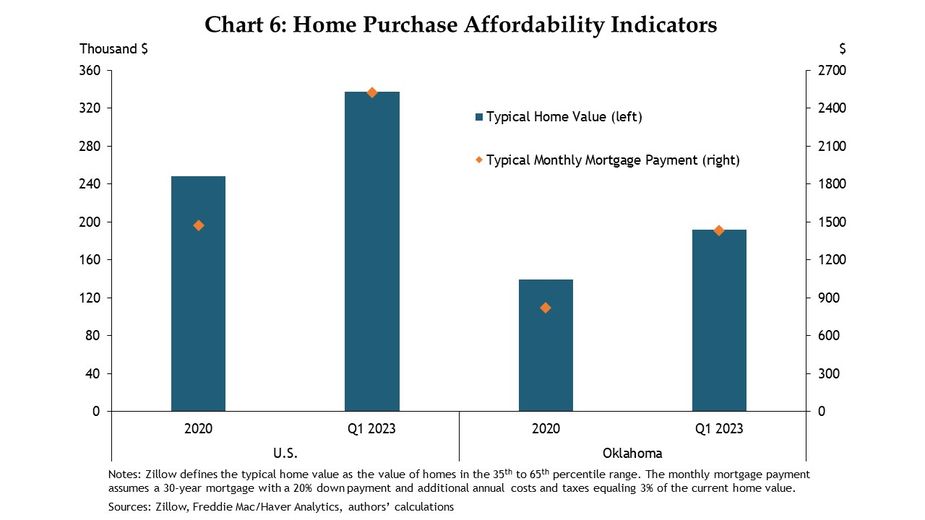
Following the significant increases in home prices in 2020 and 2021 and rapid rise in mortgage rates in 2022, mortgage payments on new homes shot up around the country and affordability has suffered. The typical home value in the U.S. increased from $248,000 in 2020 to $337,000 in Q1 2023, a 36% increase (Chart 6). The typical home value in Oklahoma increased by 38% from approximately $139,000 in 2020 to $192,000 in Q1 2023. Based on these home values and Freddie Mac’s reported mortgage rates, the typical monthly mortgage payment for a new 30-year mortgage with a 20% down payment increased by nearly 75% during this period in both the U.S. and Oklahoma, assuming that additional annual home costs equal 3% of the current home value._ The typical monthly payment for a house bought in the first quarter of 2023 in the U.S. was $2,522, up from $1,471 for a house bought in 2020. The typical new mortgage payment in Oklahoma reached $1,433 a month in Q1 2023, up from $823 in 2020.
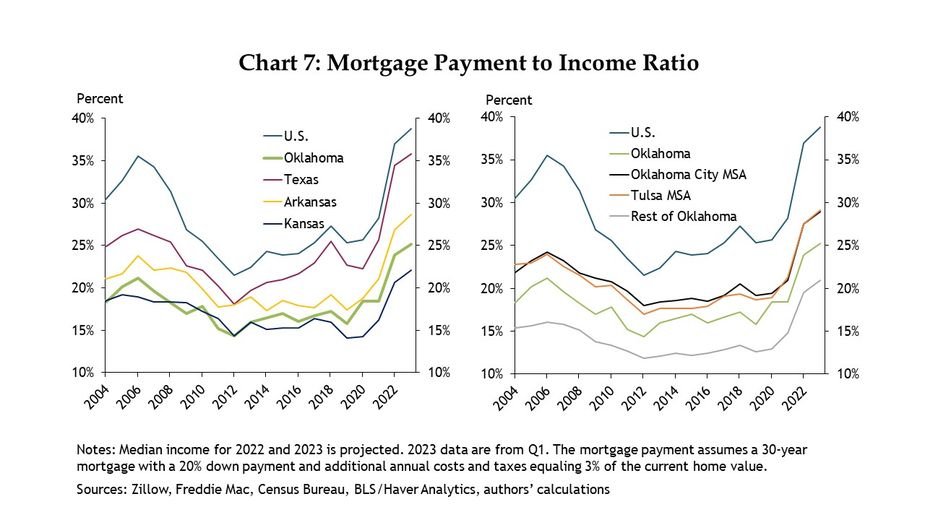
However, while purchasing a home costs considerably more for nearly all Americans than it did a few years ago, Oklahoma has actually increased its affordability edge. In the first quarter of 2023, the typical monthly payment on a new mortgage accounted for 25% of the median income in Oklahoma, up from 24% in 2022 and 18% in 2021 (Chart 7)._ In the nation however, the typical payment on a new mortgage was 39% of U.S. median income in Q1 2023, up from 37% in 2022 and 28% in 2021. Oklahoma also remains more affordable than neighboring states Texas and Arkansas. Oklahoma City and Tulsa are somewhat less affordable than the state, with mortgage payments accounting for approximately 29% of income, while payments in the rest of the state only make up about 21% of income. In addition, the spread between Oklahoma’s ratio and the United States’ ratio has increased to approximately 13 percentage points, up from 7-10 percentage points prior to the pandemic, raising Oklahoma’s relative affordability advantage even further.
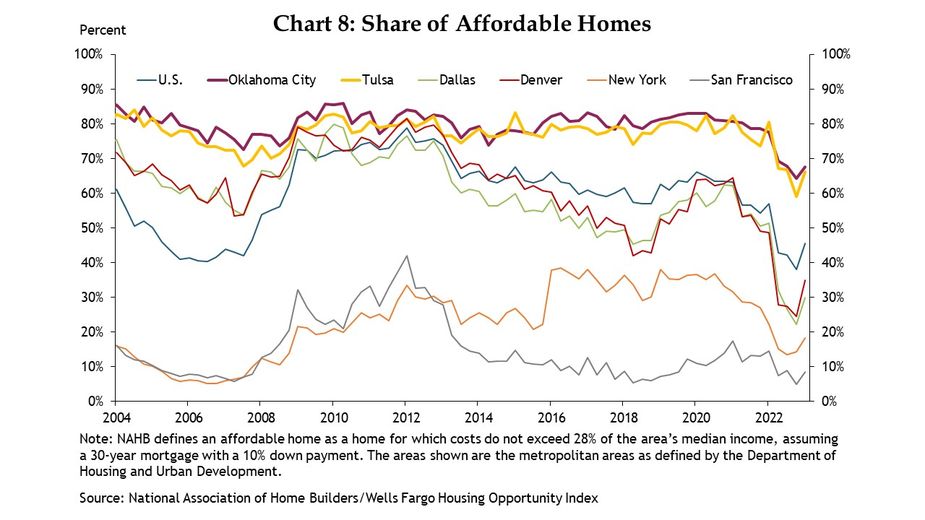
Another indicator that Oklahoma’s affordability edge has increased further, despite recent surges in prices and mortgage rates, is the share of affordable homes in the state. This measure is defined by the National Association of Home Builders as the ratio of homes sold for which costs do not exceed 28% of the area’s median income. Historically, Oklahoma City and Tulsa’s share of affordable homes hovered around 75-85% (Chart 8). The Oklahoma metros maintained a fairly steady share of affordable homes from 2013 to 2022, even as the national average and other markets’ shares declined. The oil bust in 2015 in Oklahoma may be a contributing factor to Oklahoma’s affordability edge in the years since then, as the state’s housing market dampened due to that industry’s slowdown. Only recently have the Oklahoma metros seen a sizable shift in the share of affordable homes, as Oklahoma City’s decreased from 78% in the first quarter of 2022 to 64% in the fourth quarter, a 17% decline. Similarly, Tulsa’s decreased by 27% in the same period, from 80% to 59%. This occurred during a time of steeper mortgage rates and elevated home prices as the national share of affordable homes fell by 33%, with only 38% of homes being affordable. Oklahoma’s metro areas remain much more affordable than other regional cities, like Dallas and Denver, which as recently as a decade ago were nearly as affordable as Oklahoma City and Tulsa, let alone high-priced coastal cities like New York and San Francisco.
Even as home-buying costs have shifted significantly, home and apartment rental affordability has deteriorated only moderately in both the U.S. and Oklahoma. Renting a home requires approximately 30% of the median income in the U.S. and around 23% in Oklahoma City and Tulsa, up just a few percentage points from 2019._ Apartment rental affordability has fallen by an even smaller amount, costing around 35% of the median income in the U.S. on average, and around 17% in the Oklahoma metros, just a small amount more than in 2019.
Heading forward, any slowing—or even decline—in home prices could improve affordability in the state. Following the large pandemic increases, home price inflation has slowed considerably over the past year, based on several home price sources. The Freddie Mac index fell to only 1.7% year-over-year growth in Oklahoma in April and nearly 0% growth in the nation. Redfin’s three-month average median sale price declined year-over-year in the U.S. for the first time in over a decade in April and only grew at 2.4% in Oklahoma. Even Zillow’s typical home value metric—which accounts for all homes in an area, not just homes on the market—is nearing 0% growth in the nation. Home value growth remains higher than sale price growth, especially in Oklahoma where home value growth is slowing, but still at 7.2% year-over-year in April
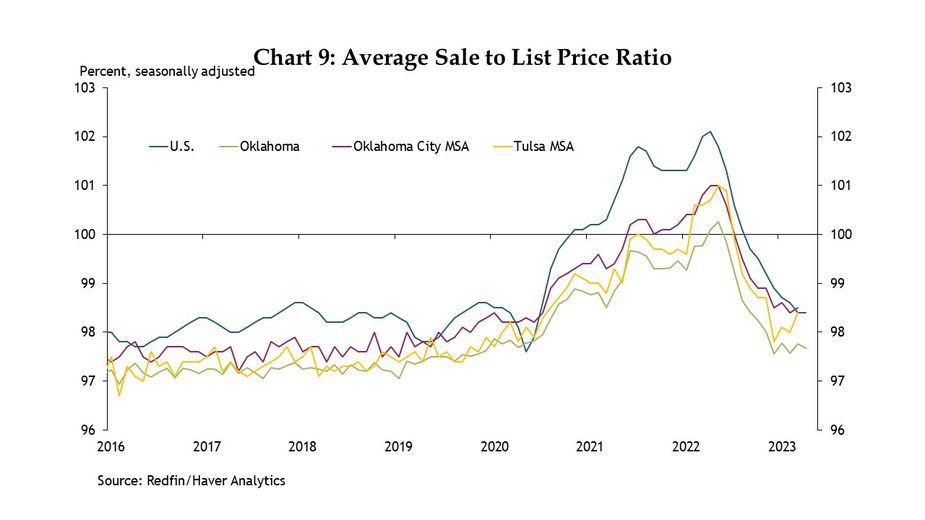
This spread between sale price and home value growth signals that demand is slowing enough to cool prices after they’ve entered the market. When demand increased during the pandemic, the average sale to list price ratio exceeded 100% in the U.S. and Oklahoma for the first time in at least a decade, meaning sale prices were actually higher than initial list prices (Chart 9). Since then, the ratio returned closer to its historical level, at around 98% of asking prices in April. This easing in prices may already be reflected in the increased share of affordable homes in the first quarter of 2023 shown in Chart 8, as the share ticked up somewhat to 46% in the U.S. and to around 67% in both Oklahoma City and Tulsa.
Summary and Conclusions
The U.S. housing market has experienced a turbulent three years as Americans’ incomes and lifestyles were altered significantly by Covid-19. Higher incomes and lower mortgage rates fueled strong increases in housing demand that lowered supply and propelled home prices. Other pandemic trends, like domestic migration to mid-sized markets and accelerated urban sprawl, may have magnified this effect in Oklahoma. Despite these large price increases, which reduced overall affordability, housing in Oklahoma is still much more affordable than the nation, even when taking income differences into account. As mortgage rates have risen over the past year and a half, demand declined and price growth has eased, which could provide some degree of relief for homebuyers, especially if the market continues to soften.
Endnotes
- 1
-
2
Months of supply is calculated as the number of homes sold in a given month divided by the number of homes for sale. This indicates how many months it would take for all homes currently on the market to sell.
- 3
-
4
Small Metro/Micro Areas include Lawton, Enid, Fort Smith (Sequoyah County), and the 20 micropolitan statistical areas defined by the Census Bureau. Rural Areas include the 40 counties in Oklahoma not within a metropolitan or micropolitan area as defined by the Census. The typical home value for small metro/micro areas is calculated by taking the average of each metro or micro area’s monthly home value weighted by housing stock for that area’s county/counties for that year. The typical home value for rural areas is calculated by taking the average of each rural county’s monthly home value weighted by that county’s housing stock for that year. Housing stock estimates from 2021 are used for the years 2022 and 2023.
- 5
- 6
-
7
We follow External LinkRappaport’s (2023) assumption that additional annual home expenses beyond principal and interest of the mortgage—such as insurance, taxes, maintenance, and a risk premium—equal 3% of the home’s current purchase price.
-
8
The mortgage payment is constructed as the average monthly payment for that year using the typical home value of each area from Zillow and the 30-year mortgage rate reported by Freddie Mac, assuming a 20% down payment. The typical home value for the rest of Oklahoma is calculated by taking the average of each county’s monthly home value weighted by that county’s housing stock for that year. Housing stock estimates from 2021 are used for the years 2022 and 2023. Median income is estimated by the U.S. Census Bureau through 2021. The median income for Oklahoma City, Tulsa, and the rest of Oklahoma is calculated by taking the average of the median incomes in their respective counties weighted by housing stock. Median income for 2022 is projected using a yearly growth rate calculated by averaging the average yearly income growth from 2017-2021 for each area and the wage growth for each area—estimated by the Bureau of Labor Statistics—from March 2021 to March 2022. Median income for 2023 is projected using a yearly growth rate calculated by averaging the average yearly income growth from 2017-2021 for each area and the wage growth for each area from March 2022 to March 2023.
-
9
Oklahoma City and Tulsa rent payments and income estimates are an average of the payments and incomes in each metro weighted by housing stock. Home rents are sourced from Zillow’s observed rent index, apartment rents are sourced from CBRE Econometric Advisors, and housing stock and median income is sourced from the U.S. Census Bureau. Income for 2022 and 2023 is projected as described in note 8.