U.S. and foreign tariff announcements and trade discussions in 2018 have created uncertainty among producers, consumers, and economists about potential effects on economic activity. Since early 2018, the United States has implemented tariffs on: steel, aluminum, solar panels, Chinese technology and appliances, and a number of other items. Retaliatory tariffs have been imposed by China and other countries on soybeans and other U.S. goods. A new trade agreement with Canada and Mexico was recently announced, and trade discussions with a number of countries remain ongoing. This edition of the Oklahoma Economist examines recent trade data in Oklahoma to see how the state’s manufacturing sector and overall economy are holding up in this environment.
How much does Oklahoma export and import, and where?
Compared with the United States as a whole, international trade is a relatively small share of Oklahoma’s GDP. As such, trade issues likely affect the Oklahoma economy less than the nation. In fact, goods exports as a share of GDP have declined slightly over the past decade and accounted for less than 3 percent of Oklahoma’s GDP in 2017, less than half as much as in the nation as a whole (Chart 1). Goods imports are somewhat larger in Oklahoma, at 5.1 percent of GDP, but again also are a much smaller share of overall economic activity than in the nation.
Chart 1. Goods Exports and Imports as a Share of GDP
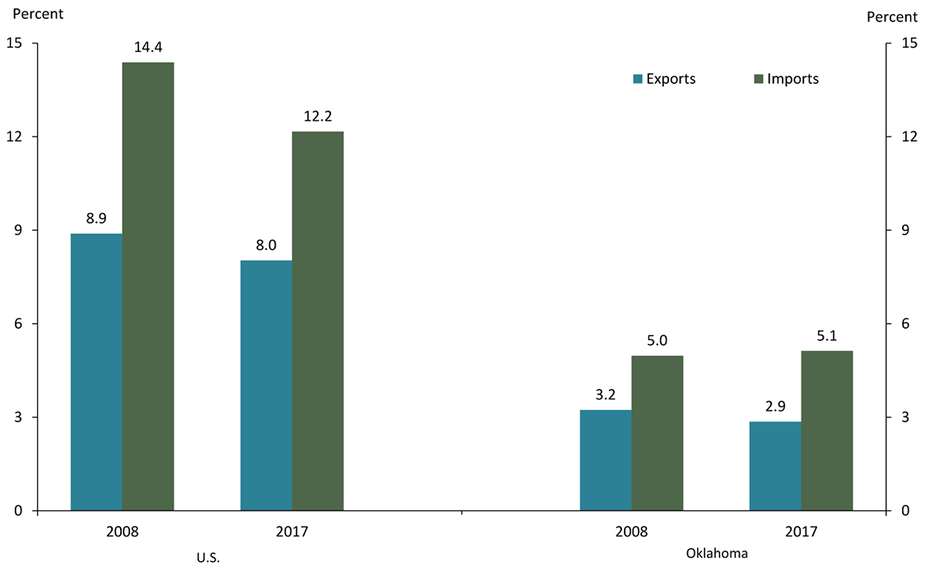
Sources: Bureau of Economic Analysis/Haver Analytics, WISERTrade, authors' calculations.
The primary categories of goods that Oklahoma exports and imports as well as its primary trade partners are shown in Chart 2. Canada is Oklahoma’s most significant trade partner, comprising more than 25 percent of total exports and more than 30 percent of imports. Oklahoma also exports nearly 21 percent of its goods to the European Union (EU), while roughly 26 percent of the state’s imports come from China. Metals and machinery are the largest share of the state’s exports, especially machinery. Mining and chemicals, especially oil and gas related items, remain Oklahoma’s largest import category.
Chart 2. Oklahoma's Goods Exports and Imports
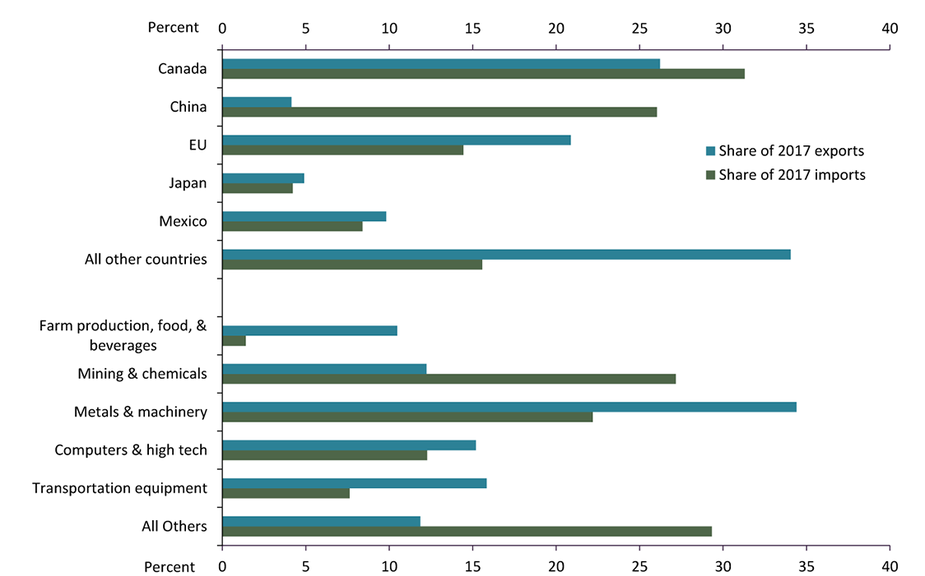
Sources: WISERTrade, authors' calculations.
Recent trends in Oklahoma’s international trade
Oklahoma’s overall goods exports and imports compared with the nation have been more volatile in recent years. Both declined sharply in 2015-16 (Chart 3). The steep decrease in exports during that time period likely was driven in large part by difficulties in the energy sector, as the biggest drops were in the machinery, plastics, and metal manufacturing industries._ Oklahoma’s imports also fell sharply, especially in the oil and gas and machinery industries. However, both imports and especially exports have risen solidly for the past year and a half.
Chart 3. Goods Exports and Imports
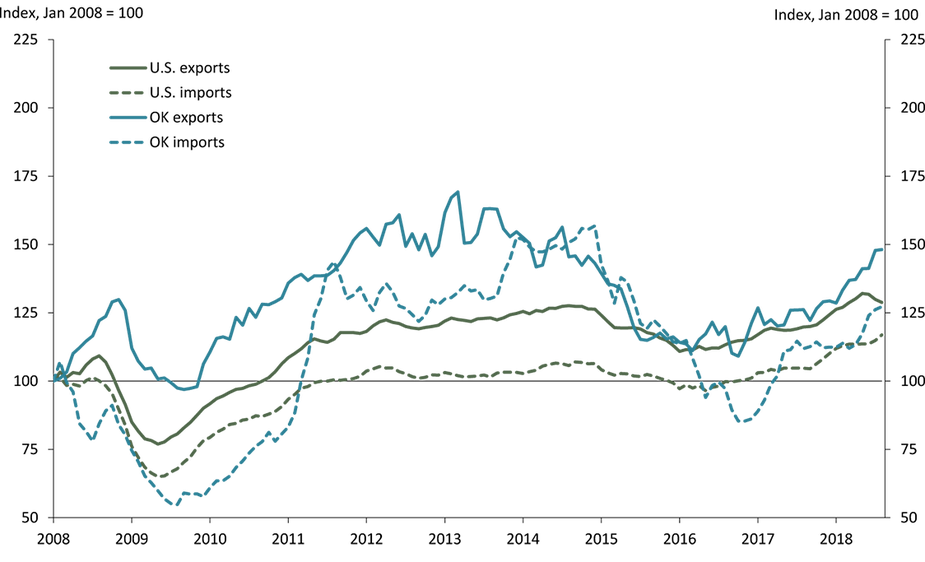
Note: Monthly data shown using three-month moving average.
Sources: U.S. Census Bureau, WISERTrade/Haver Analytics.
Indeed, goods exports over the past year in Oklahoma, through August 2018, have been strong, rising more than 30 percent, nearly four times the national average (Chart 4, measured by dollar value). Moreover, exports have risen to all major trade partners and in all major industry categories. Oklahoma’s export growth has been strongest to Mexico, followed by the EU, driven primarily by increased exports to Germany and Italy. Oklahoma’s major exports to these countries are food and agricultural products, transportation equipment, chemicals, and manufactured machinery. Across all destinations, industries with the highest export growth over the past year have been transportation equipment, chemicals and plastics, machinery, and oil and minerals.
Chart 4. Oklahoma Goods Exports by Destination and Sector
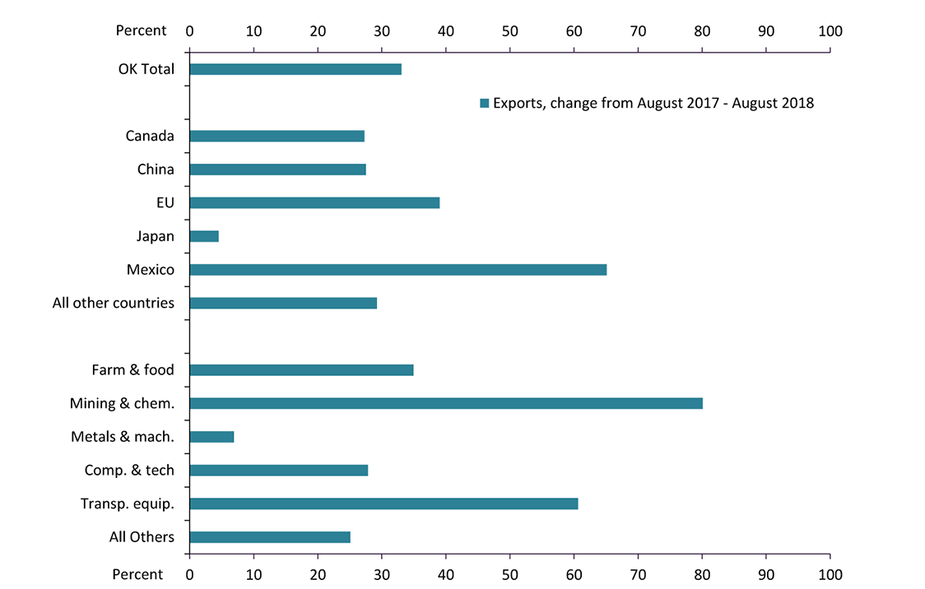
Sources: WISERTrade, authors' calculations.
Price effects
Although import data for detailed destinations and industries are not available on a timely basis, another way the import sector can affect manufacturers is through prices. Many manufacturers import materials from abroad, so trends in materials prices may help explain the tariffs on Oklahoma manufacturers. One source of this information is the Kansas City Fed’s monthly manufacturing survey.
Earlier this year, the price index for raw materials in that survey showed a sizable increase, even before tariffs were imposed, and likely in anticipation of them (Chart 5)._ Increases in materials prices for regional manufacturers remained large early in 2018, but in recent months price pressures have come down somewhat. The share of firms expecting additional increases in materials prices also has eased slightly since June, but price expectations still remain high. Although the price index for finished goods remains lower than that for raw materials, many firms have been able to increase their finished goods prices this year, helping to maintain profit margins somewhat in the face of rising materials costs.
Chart 5. Manufacturing Price Indexes, 2008 - present
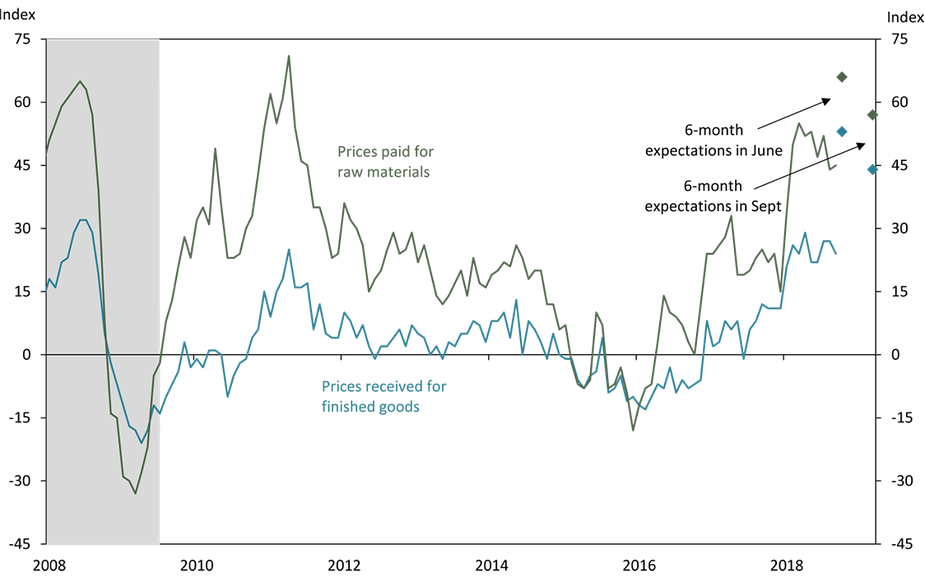
Sources: Federal Reserve Bank of Kansas City, NBER recession shading.
Broader economic effects and summary
Overall, trade activity in Oklahoma appears solid following announcements and impositions of tariffs this year, although manufacturing prices have increased. Employment in both the overall manufacturing sector and broader Oklahoma economy also continued to grow solidly through August 2018; factory job growth, however, has slowed from earlier strong growth (Chart 6). Manufacturers responding to recent Kansas City Fed manufacturing surveys also have remained positive about factory activity in the region over the next six months, despite more than two-thirds of firms in the September 2018 survey reporting being negatively affected by tariffs.
Chart 6. Employment Growth, 2013 - present
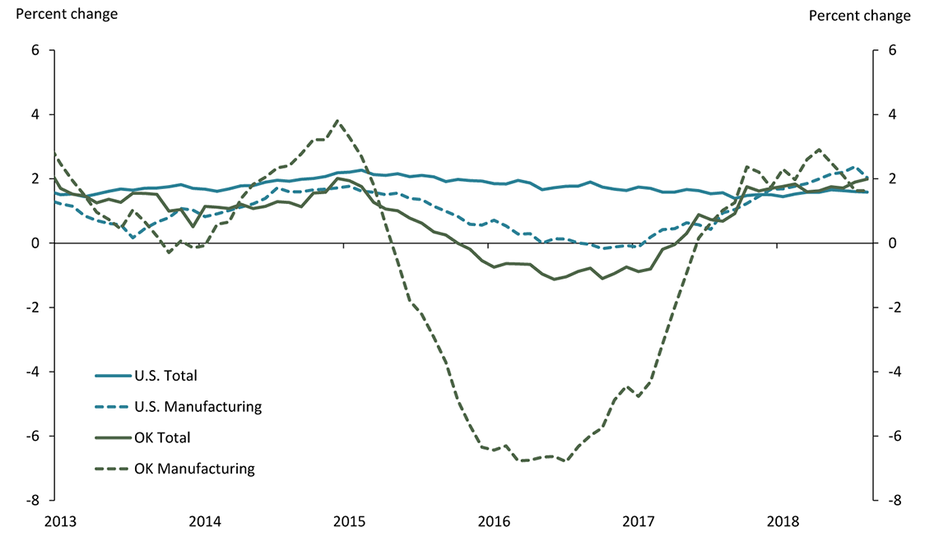
Source: Bureau of Labor Statistics.
In summary, while tariffs and trade concerns remain on the radar screens of economic analysts, businesses, and consumers, the effects to date do not appear to have significantly diminished overall factory activity or economic activity in Oklahoma. While these conditions could change, Oklahoma’s lower reliance on international trade as a share of its economy suggests future effects also would seem likely to have relatively less effect in the state than in the nation.
Endnotes
-
1
U.S. Census Bureau, External Linkhttps://www.census.gov/foreign-trade/statistics/state/data/ok.html
-
2
Not all materials are imported, so this index only partly reflects import price trends.