Following several years of relatively steady growth and low volatility, U.S. and world stock market indexes in early 2018 have experienced sharp fluctuations. This edition of the Oklahoma Economist investigates the extent of Oklahomans’ investments in the stock market. Current and historical comparisons are made with the entire nation, other states and across income groups to see the relative degree to which the state’s economy could be affected by market moves.
Oklahoma now more similar to the nation
Estimated per capita stock market wealth in Oklahoma in 2016, the last year for which data can be constructed, was just slightly below the national average (Chart 1).
Chart 1. Estimated Real Per Capita Stock Market Wealth, 1966-2016
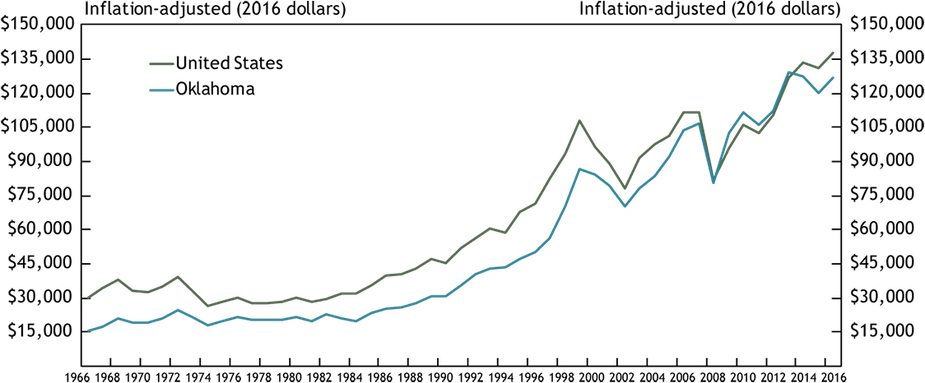
Source: U.S. Bureau of Economic Analysis, Federal Reserve Board, and author's calculations
Stock market wealth data at the state level are not available. However, such data can be estimated by applying each state’s share of national dividend income—based on data from the U.S. Bureau of Economic Analysis’ Regional Economic Accounts—to the national total of corporate equities, mutual funds and pension fund reserves held by households and nonprofits from the Federal Reserve’s U.S. Flow of Funds accounts._ Using this method, per capita stock market wealth in Oklahoma in 2016 was just over $125,000, compared with slightly more than $135,000 in the entire nation.
The average stock market wealth of Oklahomans has risen sharply since the mid-1980s. Per capita stock market wealth in Oklahoma was less than $20,000 in 1984 (in 2016 dollars), less than two-thirds of the national average at the time of just over $30,000. Since then, the state’s real stock market wealth has grown more than 500 percent, and now is more than 90 percent of the national average. Indeed, from 2009 to 2013, during the recent oil boom, Oklahoma’s per capita stock market wealth was slightly more than the national average for the first time. This relative improvement in Oklahoma’s stock market wealth has coincided with a general increase in per capita incomes in the state, a trend noted in the Oklahoma Economist for the third quarter of 2017.
Largest exposure in higher-income states and households
Oklahoma’s stock market wealth now is in the middle quintile among states (Map 1).
Map 1. Estimated Per Capita Stock Market Wealth, 2016
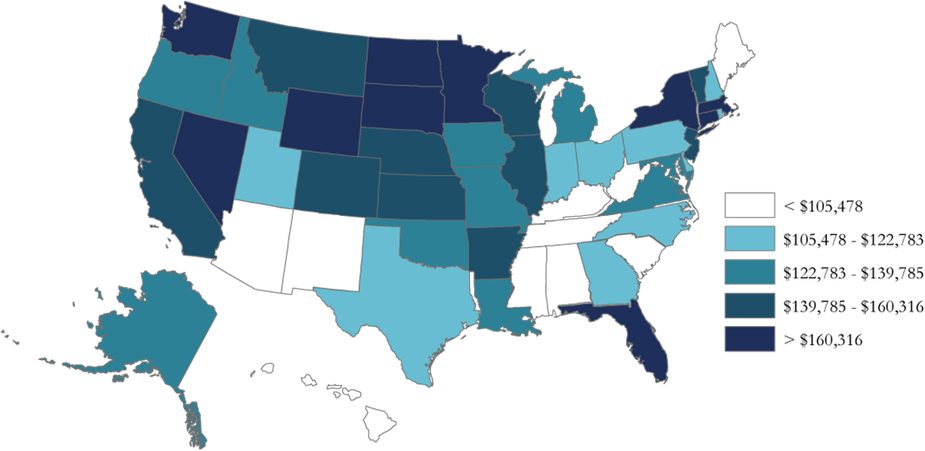
Source: U.S. Bureau of Economic Analysis, Federal Reserve Board, and author's calculations
As such, movements in markets likely affect the state overall fairly similarly to the entire nation. In contrast, some states—mostly southern—have much less stock market wealth than the nation. Meanwhile, some states have considerable stock market wealth, and thus their economies could be more susceptible to swings in stock market wealth. In three states—Wyoming, Connecticut and Florida—states with large numbers of high income earners or retirees, estimated per capita stock market wealth exceeds $200,000.
In Oklahoma, as in other states, stock market wealth is held largely by higher-income individuals and households. IRS tax return data from 2015 show Oklahomans with adjusted gross income of $200,000 or more accounted for just 3 percent of total tax returns filed in the state, but 58 percent of dividend income, a proxy for stock market holdings (Chart 2).
Chart 2. Distribution of Total and Dividend Income across Tax Filing Groups, Oklahoma 2015
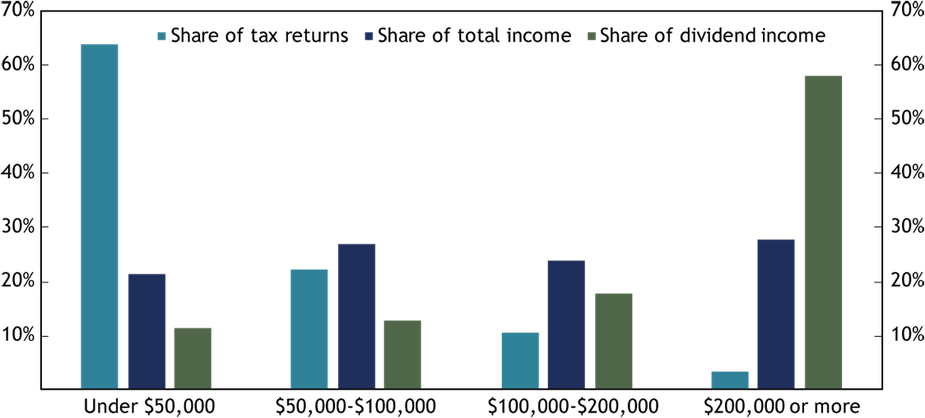
Source: U.S. Internal Revenue Service
Oklahomans with incomes between $100,000 and $200,000 accounted for another 18 percent of dividend income. That means individuals and households with incomes less than $100,000—more than 85 percent of all Oklahoma tax filers—earned less than a quarter of total dividend income in the state.
Summary and conclusions
Oklahoma’s stock market wealth has risen considerably in recent decades, more than in the entire nation. Indeed, over the past decade, Oklahoma’s per capita investment in the stock market has been relatively similar to the nation after lagging in previous decades. The majority of stock market wealth in Oklahoma, as in other states, is held by the highest-income households, those with incomes of $200,000 or more. As such, increased fluctuations in markets now could affect Oklahoma about the same as the nation, but with effects largely concentrated among high-income households.
______________________________________________________________________________
Endnotes
-
1
For more details, see Wilkerson and Williams (2011), “Booms and Busts in Household Wealth,” Federal Reserve Bank of Kansas City, Economic Review, Q2.