The downturn in Oklahoma’s economy in 2015-16, driven by a drop in commodity prices, hit much harder in smaller areas of the state than the Oklahoma City and Tulsa metro areas. But as oil prices stabilized in late 2016 and early 2017, so did the economy in most of nonmetro Oklahoma._ Job growth has begun to pick up in mid-2017, and unemployment outside the two large metros is lower than in early 2014. Moreover, per capita income in most of nonmetro Oklahoma relative to the nation has risen solidly since 2001. Slow growth in the labor force outside the two large metros remains a challenge but, overall, Oklahoma’s nonmetro economy has performed relatively well in the 21st century.
Recent struggles but still solid economic conditions
Oklahoma employment outside of the Oklahoma City and Tulsa metro areas suffered considerably following the drop in oil prices in 2014. Nonmetro jobs began to fall in late 2014 and employment in those areas had dropped nearly 2.5 percent by the end of 2015 (Chart 1). Nonmetro employment then remained below year-ago levels through early 2017, before turning positive in recent months.
Chart 1. U.S. vs. OK Metro vs. OK Nonmetro Job Growth
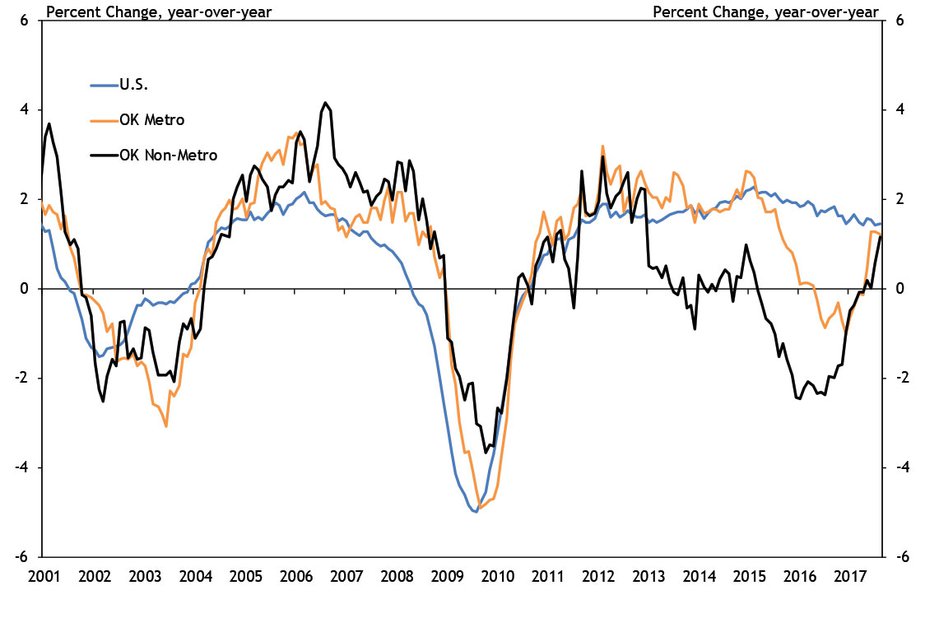
Source: U.S. Bureau of Labor Statistics
Looking at employment by industry, the largest drop in 2015 and 2016 in jobs outside Oklahoma City and Tulsa was in the mining sector, which in Oklahoma consists almost completely of oil and gas (Chart 2). Nonmetro manufacturing, financial, and professional and business services jobs also fell in both years while jobs in other sectors also fell in 2016. Over the past year, however, mining jobs have rebounded strongly amid improvement in oil prices. Jobs in other sectors have followed suit, while government employment and jobs in some private sectors have slipped.
Chart 2. OK Nonmetro Job Growth by Industry
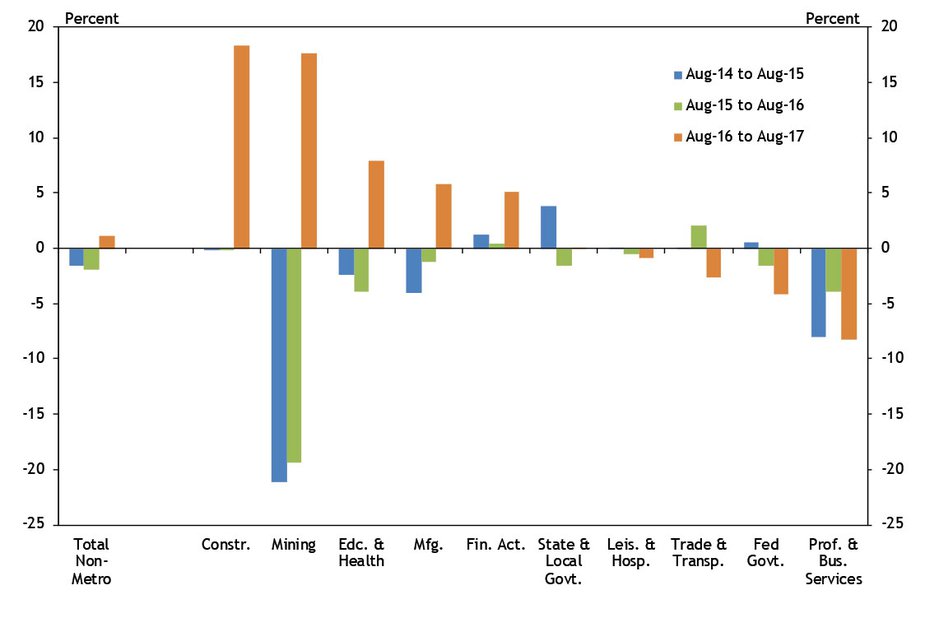
Source: U.S. Bureau of Labor Statistics
As jobs outside the two large metros have declined, the unemployment rate for nonmetro Oklahoma rose in 2015 and 2016, surpassing 5.5 percent for a time—above the metro and U.S. averages (Chart 3).
Chart 3. U.S. vs. OK Metro vs. OK Nonmetro Unemployment Rate
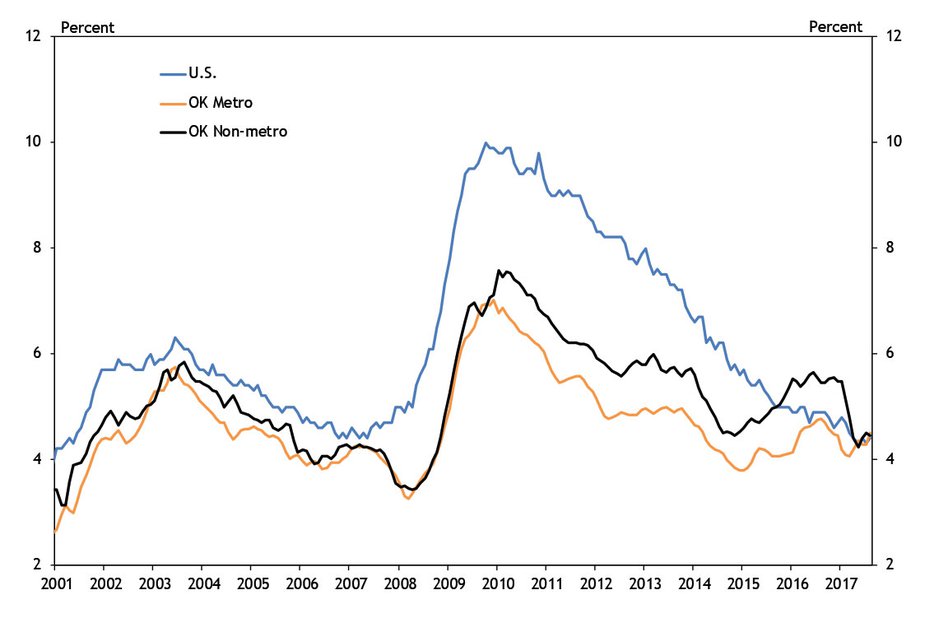
Source: U.S. Bureau of Labor Statistics
In 2017, however, the rate has declined to about 4.5 percent, about the same as in the state and nation. Indeed, all regions of nonmetro Oklahoma have seen a sizable decline in joblessness by mid-2017 with unemployment rates of 5.1 percent or less (Map 1).
Map 1. Oklahoma Labor Force and Unemployment Rate by Region, July 2017
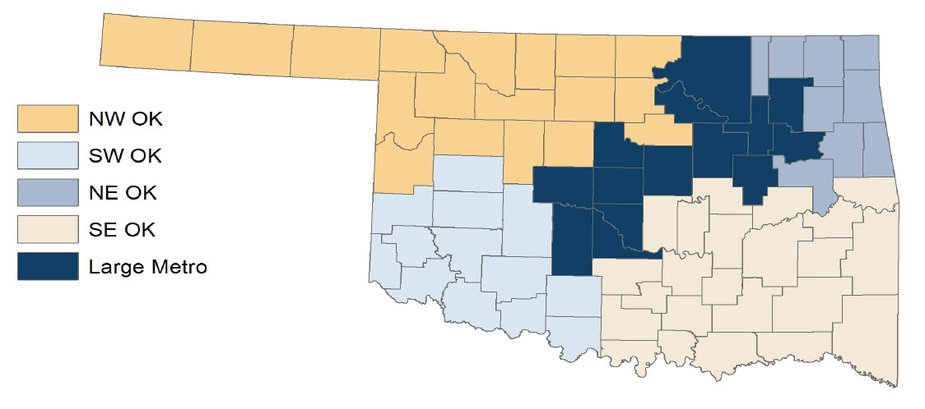
Source: U.S. Bureau of Labor Statistics and author's calculations
Part of the improvement in nonmetro unemployment rates in 2017 has been due to the stabilization and modest growth of employment outside Oklahoma City and Tulsa. Another part has been continued slower growth in the nonmetro labor force than in metro areas or the nation, a trend that was occurring prior to 2014. With fewer people entering the labor force or moving into nonmetro areas, the unemployment rate has come down but job growth has remained limited.
Rising per capita income in nonmetro Oklahoma this century
While economic conditions in nonmetro Oklahoma have been somewhat challenging in recent years, a look at the 21st century as a whole tells a generally positive story for these areas. In 2001, per capita income in Oklahoma’s nonmetro areas was less than 70 percent of the national average (Chart 4)._ It also was almost 10 percent lower than the average for all U.S. nonmetro areas. But by 2014, nonmetro Oklahoma’s per capita income had surpassed 80 percent of the national average, a sharp improvement in a little more than a decade.
Chart 4. U.S. Nonmetro vs. OK Nonmetro Per Capita Income (As a Share of National Average)
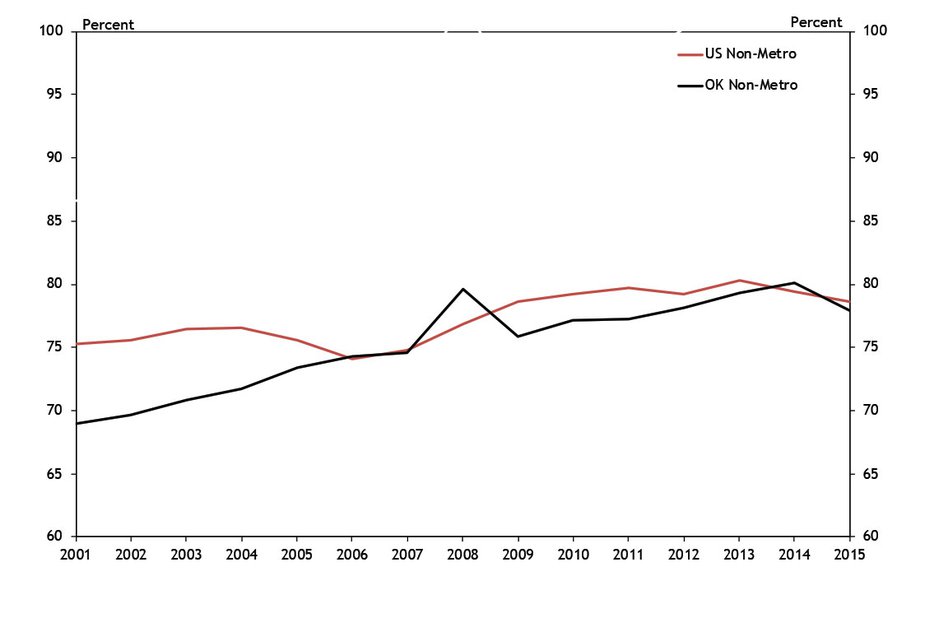
Source: Bureau of Economic Analysis
The relative improvement in nonmetro Oklahoma per capita income since 2001, however, has not been evenly distributed across the state. For example, most counties in northwest Oklahoma have seen substantial improvement in relative incomes (Map 2). In 2001, only five northwest counties had per capita income greater than 80 percent of the national average. By 2015, the latest data available, 18 counties were above that level, and six northwest Oklahoma counties actually had higher per capita income than the nation. In contrast, while some nonmetro counties in southwest, southeast and northeast Oklahoma also saw some relative improvement in per capita incomes since 2001, many did not.
Map 2. Oklahoma Per Capita Income
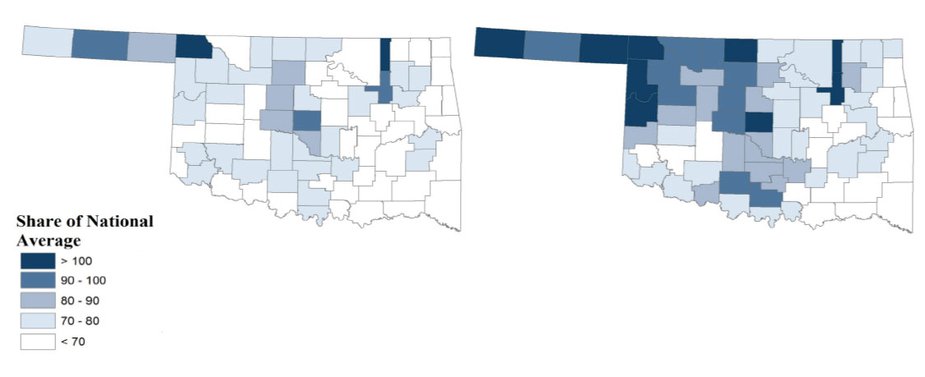
Source: U.S. Bureau of Economic Analysis
Incomes and industries vary across nonmetro Oklahoma
Across virtually all of Oklahoma outside the two large metros, the agriculture, energy, and government sectors are much more important than in the nation as a whole. However, the intensity of these industries varies across different regions of the state, and in some areas other industries also are important. These differences in industrial structure likely help explain why per capita income in some parts of the state has improved more than in others.
Table 1 shows the size of each major industry in the United States, nonmetro Oklahoma and four nonmetro subregions of Oklahoma._ Industries highlighted in red are larger than in the nation as a whole. The table also shows the pace of annual growth in total income in each industry since 2001 in nonmetro Oklahoma, with industries sorted high to low based on their growth rate. The fastest growth has been in mining, agriculture, construction and state and local government.
Table 1. OK Personal Income by Industry, 2015
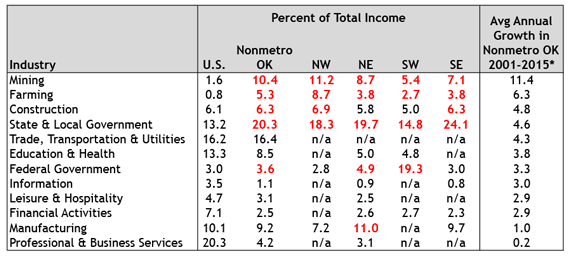
Note - 2014 percent of total income for TTU and Leis. & Hosp.
*Mining from 2002, TT&U from 2013-2014, Prof. & Bus. Services and Ed. & Health from 2013, Leis. & Hosp. from 2002-2014.
Source: BEA
Incomes and industries vary across nonmetro Oklahoma
In northwest Oklahoma, which has seen the biggest improvement in income since 2001, the mining and agriculture sectors are particularly large. Both are more important there than in the other regions of Oklahoma, and are many times more important than in the country as a whole. With these two sectors growing the fastest of all nonmetro Oklahoma economic sectors since 2001, income in this region has been boosted the most.
In southwest Oklahoma, the federal government plays an outsized role, due largely to the presence of Fort Sill in Lawton and Altus Air Force Base in Altus. Meanwhile, agriculture and energy are relatively less important than in other parts of the state, although still three times more important than in the nation as a whole. Overall, the federal government is six times more important in southwest Oklahoma than in the United States, much more than anywhere else in the state. Growth in jobs and incomes in the federal government has been slightly below average this century, likely limiting southwest Oklahoma’s gains in overall income.
In southeast Oklahoma, energy and agriculture are important, but the size of the state and local government sector is largest in this region. A key component of this sector is Native American tribal governments, which are counted as part of local government. While growth in overall state and local government income has been moderate this century, growth for tribal governments has been much stronger._ This likely has helped some parts of southeast Oklahoma—especially those with tribal headquarters or other prominent tribal establishments—see increased per capita income. On the other hand, another key sector in southeast Oklahoma is manufacturing, which is almost as large in this region as the country as a whole. Income growth in manufacturing in nonmetro Oklahoma this century has been fairly minimal, likely limiting the pace of growth in overall income in some parts of the region relative to elsewhere in the state.
In northeast Oklahoma, the agriculture, energy, federal government and state and local government sectors are relatively large. Income growth in these sectors has varied somewhat but overall has been moderately positive, likely helping to boost per capita income in some counties in the region. However, even more than in southeast Oklahoma, the manufacturing sector in northeast Oklahoma is sizable. Indeed, it is the only part of the state where manufacturing is more important than in the United States as a whole. While manufacturing in Oklahoma in general has held up somewhat better than in the country since 2001, it still has lagged many other industries, likely keeping per capita income in some northeastern Oklahoma counties from growing as much as elsewhere.
Summary
The 21st century overall has been positive economically for most of nonmetro Oklahoma. While economies outside the Oklahoma City and Tulsa metro areas have suffered job losses in recent years, unemployment in most areas has remained relatively low. Moreover, per capita income in many nonmetro parts of the state has grown solidly since 2001, driven largely in most years by positive income gains in the energy and agriculture sectors.
Endnotes
-
1
Unless noted, “nonmetro” in this article refers to all areas of Oklahoma outside the Oklahoma City and Tulsa metropolitan statistical areas (MSAs). This includes the Lawton MSA, and the parts of the Dallas-Fort Worth, TX, Fort Smith, AR, and Joplin, MO, MSAs that are in Oklahoma.
-
2
In Chart 5, “nonmetro” includes only those portions of Oklahoma that are not part of any MSA.
-
3
The nonmetro OK column excludes all areas of the state that are part of MSAs. However, the nonmetro subregions include all areas of the state except the Oklahoma City and Tulsa metro areas.
-
4
According to the Bureau of Labor Statistics Quarterly Census of Employment and Wages, average annual growth in total wages for tribal governments from 2001 to 2015 was 10.6 percent in Oklahoma, compared with 3.5 percent for all other state and local government entities.