Recent years have been difficult for Oklahoma’s important energy sector, but 2017 has begun on a positive note. After dropping sharply in 2015 and for much of 2016, drilling rig counts in the state and jobs in the energy sector have started to recover, which is likely to spur more oil production and boost tax revenues for the state in 2017. However, the extent of the recovery will depend on the future path of oil and gas prices and how those prices intersect with the prices energy firms say they need to expand activity.
How big was the decline?
Oil and gas activity in Oklahoma dropped sharply subsequent to the plunge in crude oil prices in the second half of 2014. However, the timing and extent of the drop varied across different energy sector indicators. The drop in the number of drilling rigs was relatively quick and sharp, while reductions in energy sector employment, production and the sector’s share of overall Oklahoma economic activity generally were more gradual.
Oil and gas drilling activity in Oklahoma peaked in September 2014, at 214 active rigs (Chart 1). It bottomed in May 2016 at 57 rigs, a decline of nearly 75 percent, slightly less than the 80 percent drop in the rest of the United States. Of the 157 Oklahoma rigs taken out of service, more than 90 percent were drilling for crude oil, and nearly 90 percent were horizontal rigs.
Chart 1. Total Rig Count
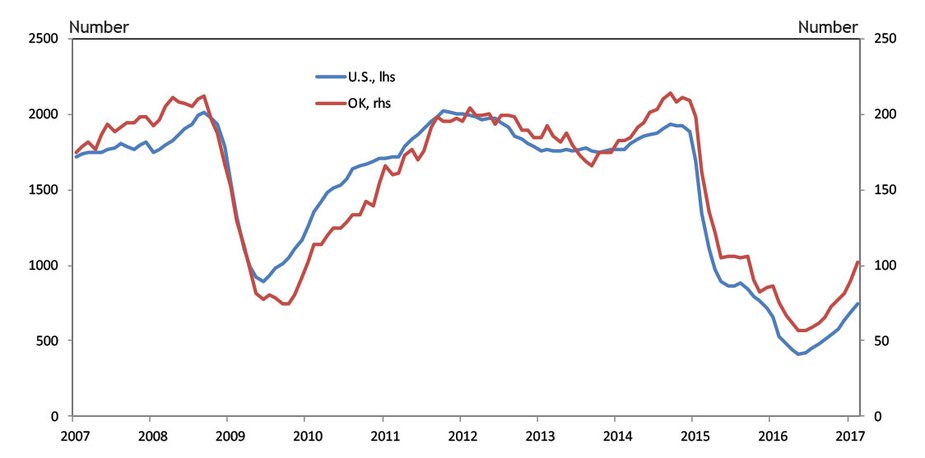
Source: Baker Hughes
Chart 2. Oklahoma Mining Employment
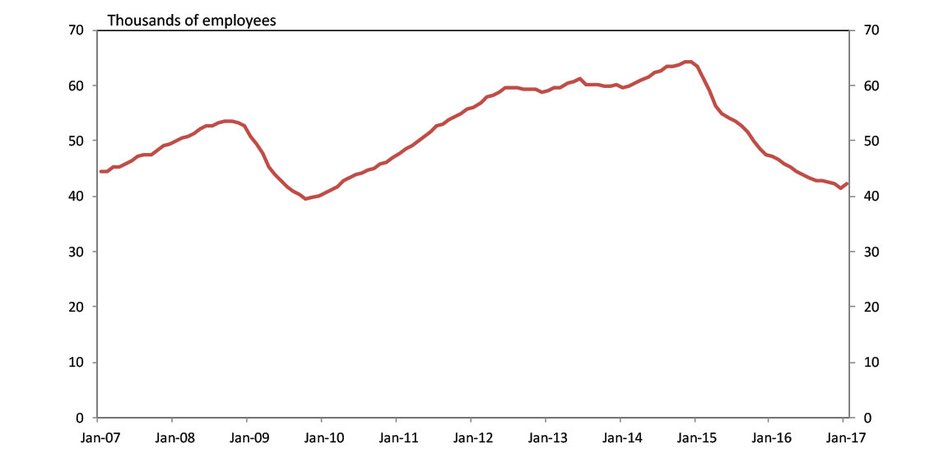
Source: U.S. Bureau of Labor Statistics
Mining sector employment in the state (mostly oil and gas employment) peaked a few months later at 64,200 jobs in both November and December 2014 (Chart 2). Mining jobs in Oklahoma then fell for the next two years, bottoming in December 2016 at 41,500, a decline of more than 35 percent.
Crude oil production in Oklahoma began to fall several months after drilling activity and employment began to decline, illustrating the lag between drilling a well and its production coming online. Oklahoma oil production peaked in March 2015 at 473,000 barrels a day (Chart 3). After falling throughout 2015 and then improving slightly in early 2016, crude oil production in the state continued to slip last year and by September was down to 411,000 barrels a day. This drop of 13 percent still was much smaller than the reduction in drilling, likely due to less-productive rigs being taken offline. Natural gas production in the state peaked a bit later, in July 2015, and by November 2016 had fallen 10 percent (Chart 4).
Chart 3. Crude Oil Production
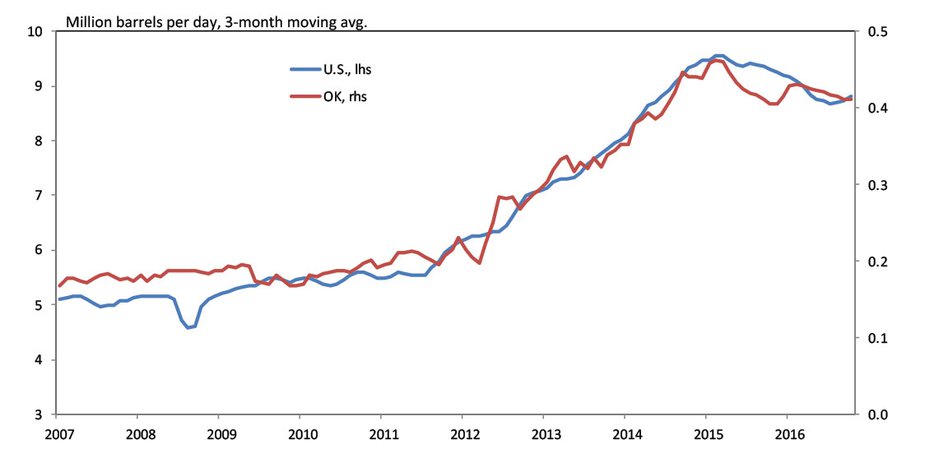
Source: U.S. Energy Information Administration
Chart 4. Natural Gas Production
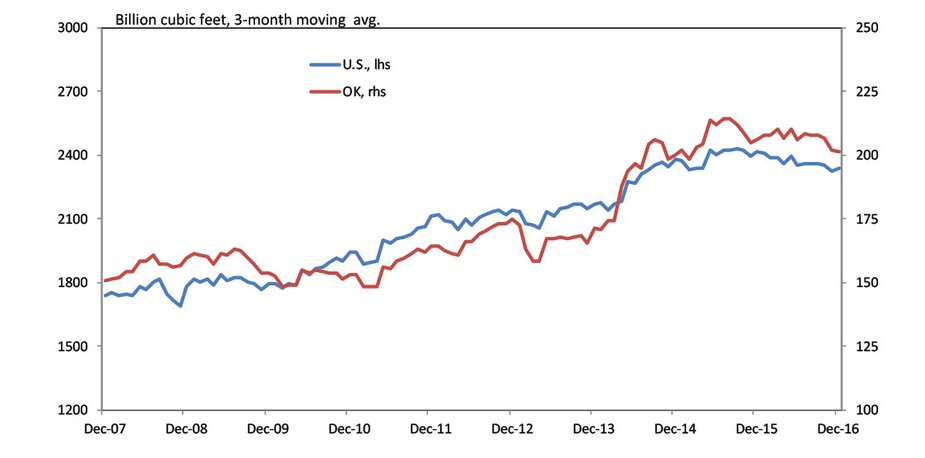
Source: U.S. Energy Information Administration
The energy sector’s share of economic activity in Oklahoma also has fallen significantly since 2014. At its peak in the first quarter of 2014, the mining sector represented more than 19 percent of Oklahoma gross domestic product (Chart 5). Two years later, the sector accounted for less than 9 percent of state GDP. The mining sector also accounted for about 13 percent of Oklahoma workers’ earnings in early 2014. By the third quarter of 2016, the sector’s share of earnings had fallen to about 9 percent. Mining’s share of total state employment similarly fell from just less than 4 percent in 2014 to a little more than 2.5 percent by late 2016. Gross production tax receipts as a share of total state tax revenues also dropped from more than 8 percent in 2014 to less than 3 percent at times in both 2015 and 2016.
Chart 5. Mining Share of GDP, Worker Earnings, & State Tax Revenues
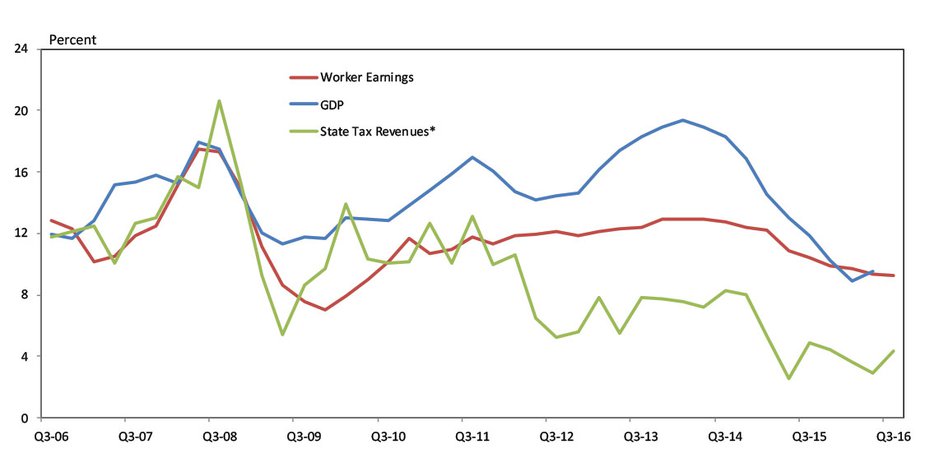
Source: U.S. Bureau of Economic Analysis, U.S. Bureau of Labor Statistics, U.S. Census Bureau
*Gross production tax receipts as share of total state tax revenues
How much recovery has occurred?
Oil prices reached a low in the first quarter of 2016, even briefly dropping below $30 a barrel. After fluctuating in mid-2016, oil prices began to increase consistently again in the second half and by year-end had surpassed $50 a barrel (Chart 6). Since then, oil prices mostly have stayed in a band of $50-55 a barrel, although prices in mid-March dipped slightly below that range. The Kansas City Fed’s quarterly energy survey has shown that, on average, prices in that band make drilling profitable for firms headquartered in the Tenth Federal Reserve District, with some firms making a profit even at prices somewhat below that range. Firms also had the opportunity to hedge some of their production for coming years at prices in this range.
Chart 6. Oil Prices
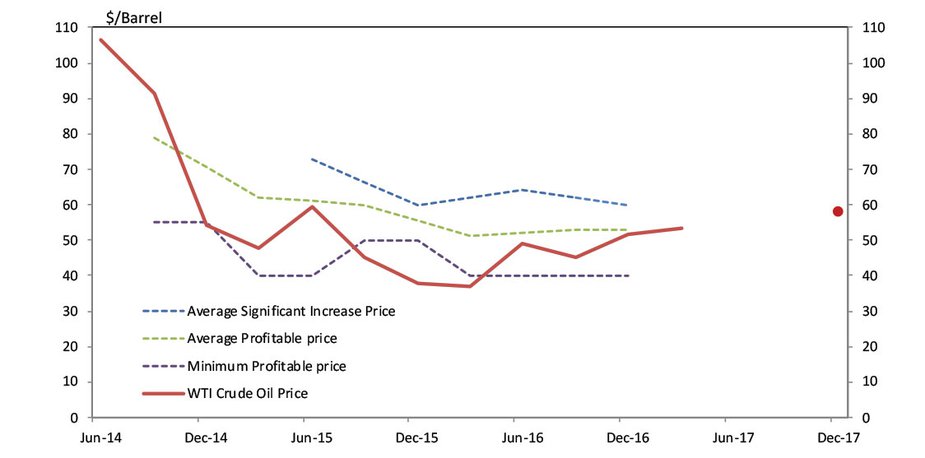
Source: FRBKC Energy Survey, Energy Information Administration
Thus, drilling in the state began to rise again in the second half of 2016 and early 2017. By February 2017, the Oklahoma rig count had surpassed 100 rigs again and was up nearly 50 percent. However, as of early March, the state rig count still remained about 50 percent less than its 2014 peak. The rebound in Oklahoma drilling primarily has been for oil, but natural gas drilling also increased slightly in early 2017 after mostly halting in the fall of 2016. Almost all of the rebound in Oklahoma drilling has been for horizontal rigs.
The latest data from the U.S. Bureau of Labor Statistics show mining employment in Oklahoma in January also grew for the first time in more than two years. The sector added 700 jobs in January, an increase of 0.4 percent. In addition, the Kansas City Fed’s fourth quarter energy survey showed that oil and gas firms on net added workers in the fourth quarter and planned to continue adding jobs in the first half of 2017.
Data through late 2016, the most recent available, show Oklahoma oil and gas production had increased only marginally from its trough. However, more timely U.S. oil and gas production data has been rising since October, and given the large increase in Oklahoma drilling observed the past eight month, it is likely that Oklahoma production also is rising again. This is especially true given that the rebound in drilling has been completely for horizontal rigs that generally are capable of much greater production than vertical or directional rigs.
What might the future hold?
Continued expansion in Oklahoma’s energy sector will depend on how profitable it remains to drill for oil and natural gas. Thus, both the future path of commodity prices and the cost structure of the industry will help determine how much expansion occurs in drilling, employment, production and tax revenues.
The Kansas City Fed’s quarterly energy survey asks firms what price they need for oil and gas drilling to be profitable, what price they need to “significantly” increase drilling and what they expect oil and natural gas prices to be over the next one to two years. Firms also are asked about their future drilling and employment plans. Putting these pieces together provides a picture of the possible future path of activity in the region and especially in Oklahoma, as more than half of survey respondents have headquarters in the state.
For crude oil, the fourth quarter Kansas City Fed energy survey (conducted the last two weeks of 2016), showed firms on average were expecting prices to reach $58 a barrel by year-end 2017 and $63 by year-end 2018. Oil futures prices at the time were only slightly lower, but by mid-March 2017, futures prices had slipped to the lower $50s for the next couple of years. This expected level of prices remains near the average price firms now say they need to be profitable, and above the profitable price for some firms. Moreover, firms have had the opportunity to hedge some future production at profitable prices. However, these prices remain well below the $60 a barrel on average that firms say they need to significantly increase drilling. The majority of firms in the survey indicated they expect drilling activity to increase in the first half of 2017, but recent prices suggest any expansion of oil drilling is likely to remain relatively modest over the next year or more.
Chart 7. Natural Gas Prices
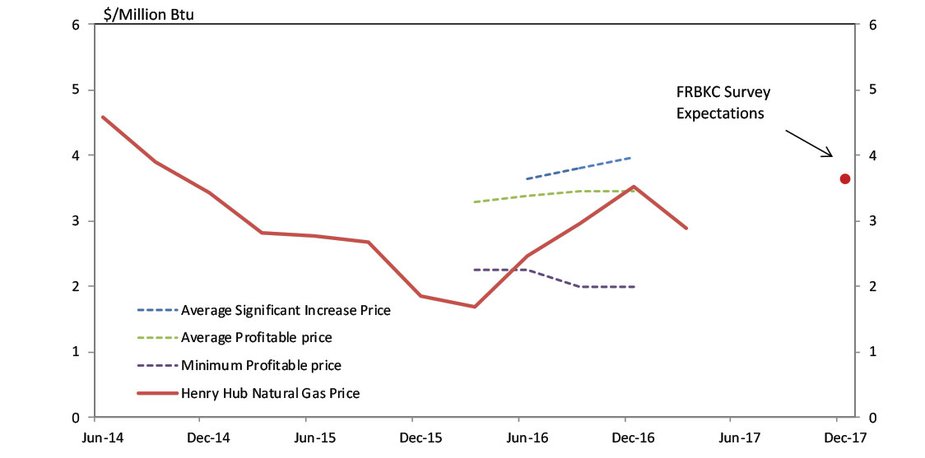
Source: FRBKC Energy Survey, Wall Street Journal
The story for future natural gas drilling is somewhat similar. At the end of the fourth quarter of 2016, firms on average were expecting natural gas prices to be $3.64/mbtu by year-end 2017 (Chart 7). This was slightly more than the average profitable price they reported needing at the time. However, by mid-March, futures prices for natural gas at year-end 2017 had fallen somewhat below average profitable prices, and well below prices needed to significantly increase drilling, although they remained profitable for some firms in the survey. This again suggests only modest expansion of natural gas drilling and production in the state in 2017.
Summary
Following two difficult years in the oil and gas sector in Oklahoma, 2017 began on a brighter note, with state rig counts and employment in the sector up from recent lows. This increase may lead to higher oil production and state tax revenues this year. However, current and expected prices for oil and natural gas remain at or just below the prices most firms say they need to be profitable, and thus the rebound in energy activity in the state is likely to remain somewhat muted without further increases in prices.