The sharp drop in oil prices since mid-2014 has had negative effects on the economies of all oil and gas states. The degree of these negative effects, however, has differed significantly across the seven states with large oil and gas sectors. This edition of The Oklahoma Economist compares recent economic indicators in oil and gas states with trends in Oklahoma. Oklahoma economic growth has been similar to several other oil and gas states, but has exceeded that of North Dakota and Wyoming and not done as well as in Texas.
Differences in broad economic indicators
There are seven states in which the oil and gas sector accounted for more than 8 percent of gross domestic product (GDP), 5 percent of personal income and 3 percent of payroll employment in 2013-14—Alaska, Louisiana, New Mexico, North Dakota, Oklahoma, Texas and Wyoming (Chart 1). On each measure, in each of these states, the sector was at least 3.5 times as large as in the United States as a whole. Outside these seven, no other state in the sector was more than 2.5 times larger than in the nation on more than one of these measures. Among these seven states, the sector was smallest in Louisiana and New Mexico, and largest—in jobs and incomes—in Oklahoma, North Dakota and Wyoming.
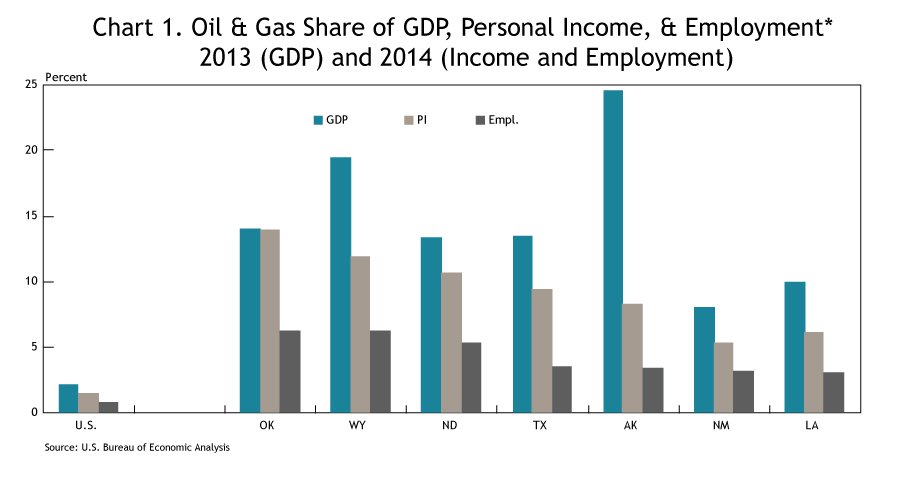
*NAICS 211 + NAICS 213
Source: U.S. Bureau of Economic Analysis
Since July 2014, oil and gas states have had three general paths in total payroll employment, the timeliest broad measure of state-level economic activity. First, Wyoming and North Dakota have experienced sizable overall job losses, with employment down more than 4 percent and more than 5 percent, respectively (Chart 2). Second, employment largely has been flat in Alaska, Louisiana, New Mexico and Oklahoma—an encouraging sign in Oklahoma given it has a larger share of jobs and income in oil and gas than the other three states. And third, in contrast to flat or declining employment in other oil and gas states, employment in Texas is nearly 4 percent higher than in mid-2014, although it has leveled off in 2016.
Trends in unemployment rates across oil and gas states largely reflect these differences in job growth. Wyoming has had the largest increase in unemployment, from 3.8 percent in early 2015 to 5.5 percent in April 2016. Unemployment in North Dakota is up 0.6 percentage point from its 2015 low, but its rate of 3.2 percent was the lowest among oil and gas states. Louisiana and Oklahoma have experienced increases of 0.5 percent in joblessness, although Oklahoma’s rate remains relatively low at 4.5 percent. Meanwhile, unemployment in Alaska and Texas, 6.6 percent and 4.4 percent, respectively, has been largely unchanged over the past year while New Mexico has seen a decline—albeit from a relatively high level.
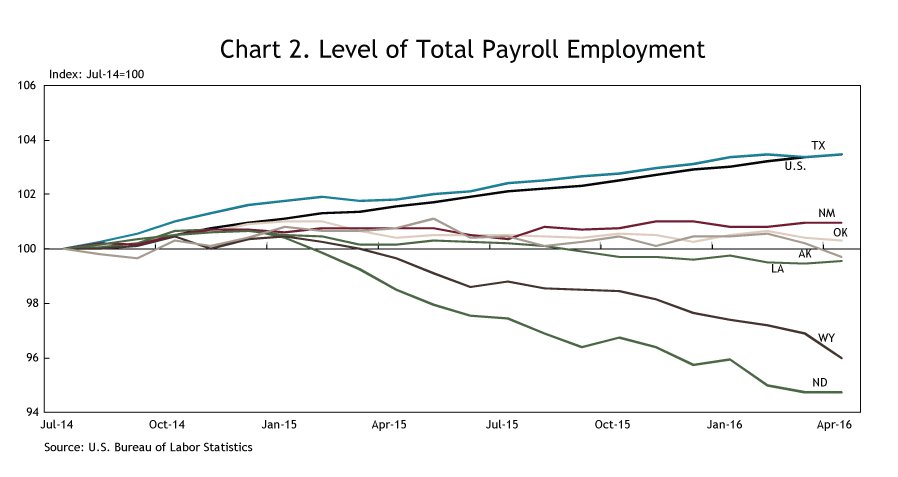
Source: U.S. Bureau of Labor Statistics
Trends in unemployment rates across oil and gas states largely reflect these differences in job growth. Wyoming has had the largest increase in unemployment, from 3.8 percent in early 2015 to 5.5 percent in April 2016. Unemployment in North Dakota is up 0.6 percentage point from its 2015 low, but its rate of 3.2 percent was the lowest among oil and gas states. Louisiana and Oklahoma have experienced increases of 0.5 percent in joblessness, although Oklahoma’s rate remains relatively low at 4.5 percent. Meanwhile, unemployment in Alaska and Texas, 6.6 percent and 4.4 percent, respectively, has been largely unchanged over the past year while New Mexico has seen a decline—albeit from a relatively high level.
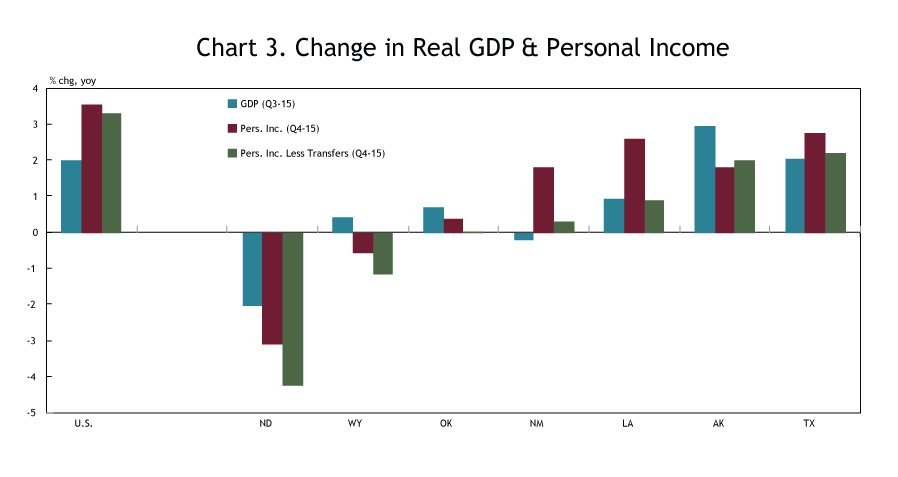
Source: U.S. Bureau of Economic Analysis
Data on real GDP and real personal income are not as timely as jobs data but reveal similar trends, with Oklahoma again near the middle of the pack (Chart 3). The most recent state GDP data are through just the third quarter of 2015, and show all oil and gas states but Alaska and Texas had weaker real output growth than the nation, with New Mexico and North Dakota experiencing declines. Personal income data are through year-end 2015 and show all oil and gas states lagged national income growth, especially once personal transfer payments are removed. The weakest income growth—in fact year-over-year declines—was in North Dakota and Wyoming, where job losses were largest.
Recent state tax revenues in oil and gas states also show large variations, with Oklahoma performing better than some states but all states experiencing decline. Because each state’s mix of tax revenues differs across income, sales, severance and other sources, it is difficult to make exact comparisons across states. But in 2015 and early 2016, the decline in state tax revenues was much larger in Alaska, North Dakota and Wyoming than in the other oil and gas states (Chart 4). Meanwhile, Texas has had a slightly smaller decline than in New Mexico and Oklahoma, while Louisiana has seen some improvement in 2016.
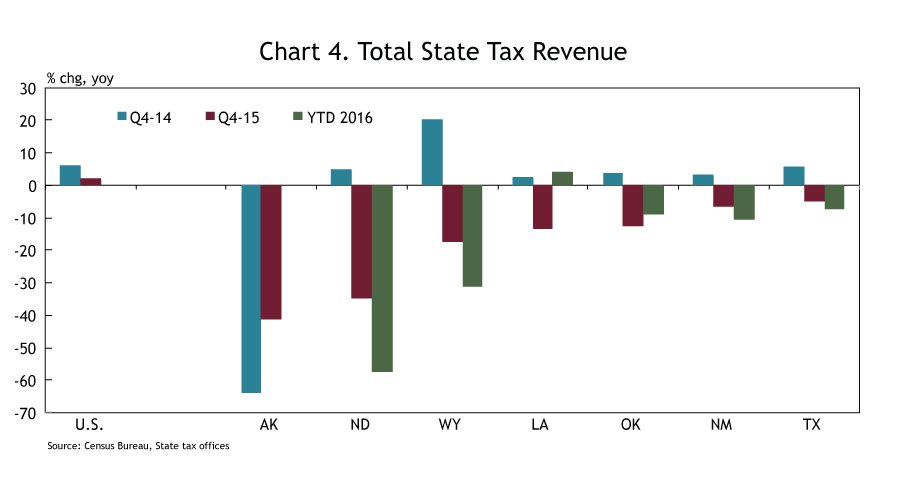
Source: Census Bureau, State tax offices
Source: U.S. Bureau of Labor Statistics
Similarities and differences across industries
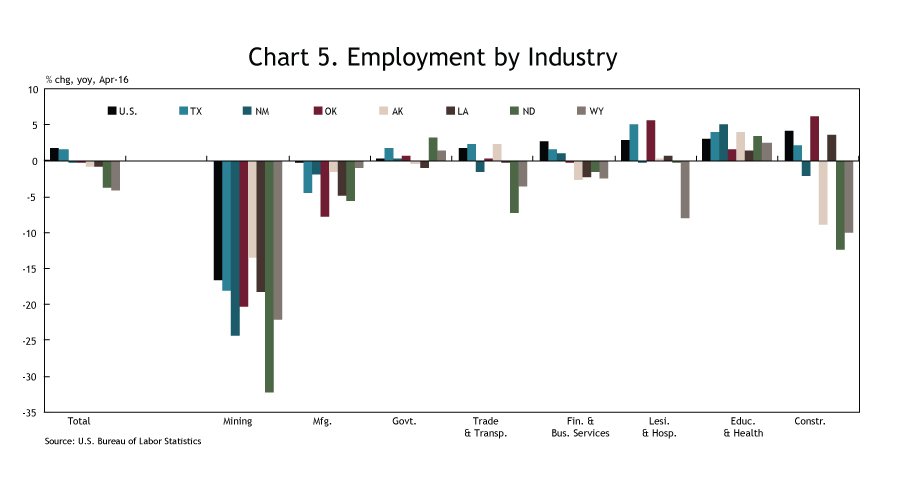
When looking at trends across specific sectors in oil and gas states, there are both similarities and differences. A key general similarity in nearly all oil and gas states is that mining sector employment—primarily oil and gas in most of these states—is down more than 18 percent since last year (Chart 5). The exception is Alaska, where mining sector employment is down 13 percent. This means differences in economic performance largely have been in other sectors in oil and gas states, but North Dakota's especially large 32-percent drop in mining jobs likely has contributed to it having the worst overall job performance.
The performance of some sectors in North Dakota and Wyoming has been worse than in other oil and gas states, helping explain their overall weaker employment. In particular, jobs in construction and in trade and transportation have declined sharply in both states, perhaps because more of the activity in those sectors was tied to oil and gas. In addition, leisure and hospitality jobs have fallen considerably in Wyoming; North Dakota has experienced larger losses of manufacturing jobs than all other oil and gas states but Oklahoma.
That said, several other sectors have performed similarly across energy states. Jobs in financial and business services have fared better nationally than in all oil and gas states, with only Texas and New Mexico avoiding outright losses. Job losses in the manufacturing sector in all oil and gas states have been larger than in the nation. Meanwhile, employment growth in education and health and in the government sector in most oil and gas states has, so far, remained relatively similar to the nation. However, recent drops in state tax revenues in all oil and gas states suggest some differences from the nation could emerge soon.
Source: FHFA
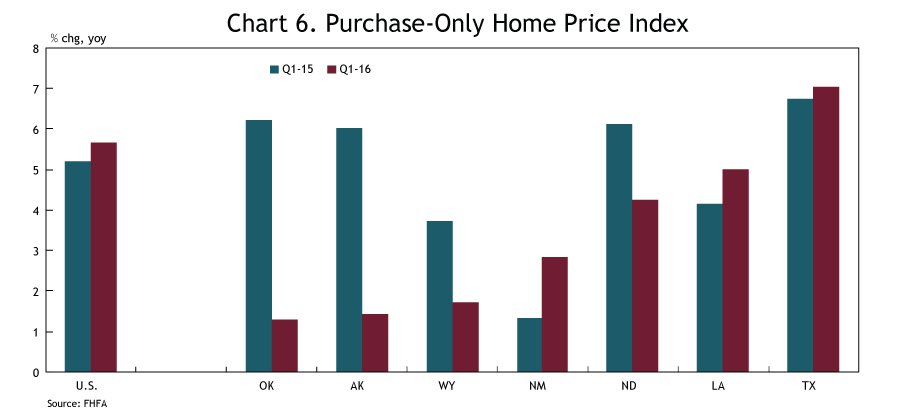
Trends in housing prices also differ across oil and gas states. Texas again has performed better than other areas and, in this case, Oklahoma ranks last among oil and gas states, although all states continue to see year-over-year price gains. Home prices nationally grew slightly faster in the first quarter of 2016 than a year earlier, at 5.7 percent (Chart 6). Among oil and gas states, only Louisiana, New Mexico and Texas experienced faster price growth, and only Texas had a higher rate of home price appreciation than the nation, in contrast to a year ago when home prices in four oil and gas states were growing faster than in the nation as a whole. In Oklahoma, home price growth dropped from 6.2 percent a year ago to 1.3 percent in the most recent data.
Why has Texas performed better than Oklahoma?
Texas has clearly outperformed Oklahoma and other oil and gas states in recent years. One reason is that relative to Oklahoma, Texas has had smaller job losses in manufacturing, likely because a smaller percentage of its manufacturing is oil and gas related. In 2013, 50 percent of Oklahoma’s manufacturing output was in fabricated metals, machinery and petroleum and coal products, compared with 40 percent in Texas.
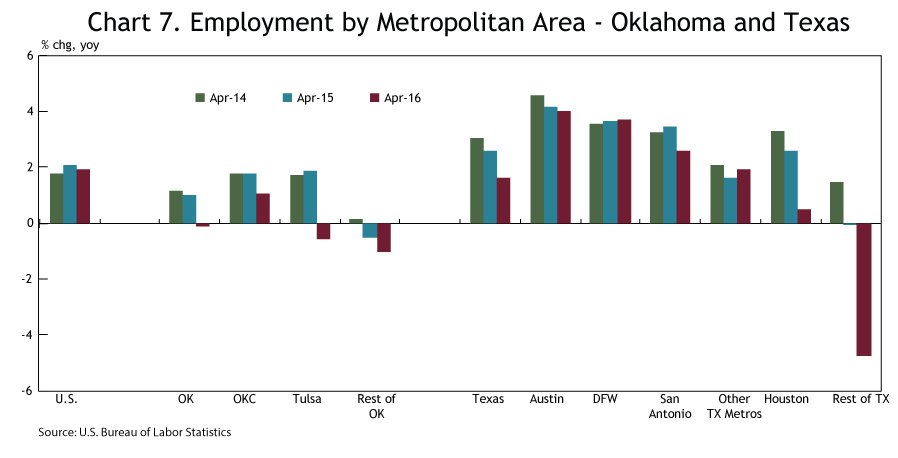
Perhaps more importantly, Texas also has outperformed Oklahoma in several large services industries, including financial and business services; trade and transportation; and education and health. Together, these three broad industries account for more half of all jobs in both states. Texas’ better performance may be the result of continued very strong job growth in three of its four largest metropolitan areas—Dallas-Fort Worth, Austin and San Antonio. Each is much less dependent on oil and gas than Houston or the two largest Oklahoma metros (Chart 7). The most recent data show that mining sector employment as a share of total metro area employment was more than twice as large in Houston, Oklahoma City and Tulsa as in Austin and San Antonio and nearly twice as large as in Dallas-Fort Worth.
Source: U.S. Bureau of Labor Statistics
Source: TWR
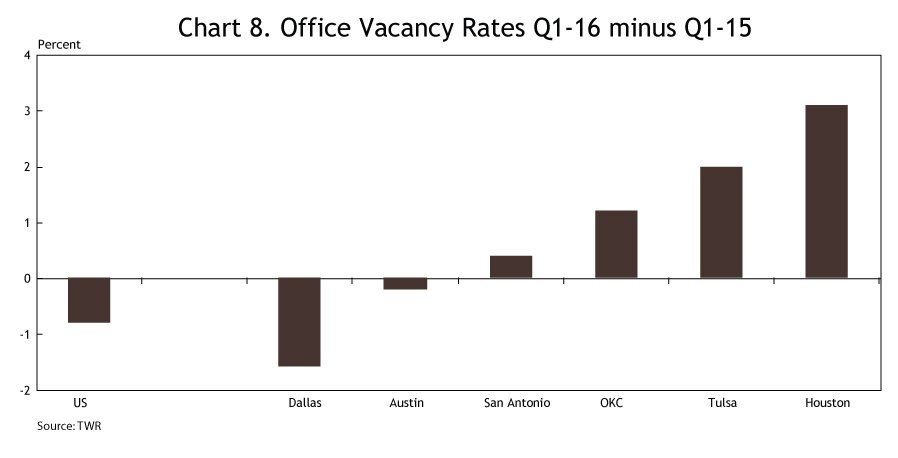
Trends in office vacancy rates in Texas and Oklahoma are consistent with these metro job trends (Chart 8). While office vacancy rates nationally have fallen over the past year by almost a percentage point, unleased space has increased 1.2 percent in Oklahoma City, 2.0 percent in Tulsa and 3.1 percent in Houston. Meanwhile, office vacancies are up only slightly in the San Antonio area, and have declined in the Austin and Dallas-Fort Worth metro areas.
Conclusion and outlook
Oklahoma’s economy, as heavily dependent on the energy sector as any state prior to the recent downturn in oil prices, has performed relatively well compared with most other oil and gas states. The latest numbers on employment, GDP and income still show flat or only slightly declining activity in Oklahoma, while state tax revenues are down somewhat more. This is in contrast to North Dakota and Wyoming, for example, which had similar-sized oil and gas sectors as Oklahoma but experienced much sharper declines in economic activity. One oil and gas state, however, clearly has outperformed Oklahoma on virtually all measures—Texas. One reason is Texas' slightly more diversified economy, especially in several of its largest cities, which rely more on business services and less on oil and gas related manufacturing than Oklahoma.
With Oklahoma already weathering the storm better than some states, the moderate improvement in oil and natural gas prices in the second quarter of 2016 is coming at a good time. Oil prices are near a level firms in the Kansas City Fed's latest energy survey said can be profitable—$51 per barrel on average in fields in which they are active. While prices will likely need to be sustained at that level or slightly higher for some time for increased oil and gas activity to occur, the higher prices could mean declines in the sector may be nearing an end. Other challenges to Oklahoma’s economy remain, including continued cuts in state government agencies and funding. However, the state’s still relatively good overall economic condition—despite huge energy sector job losses—provides encouragement for the year ahead.