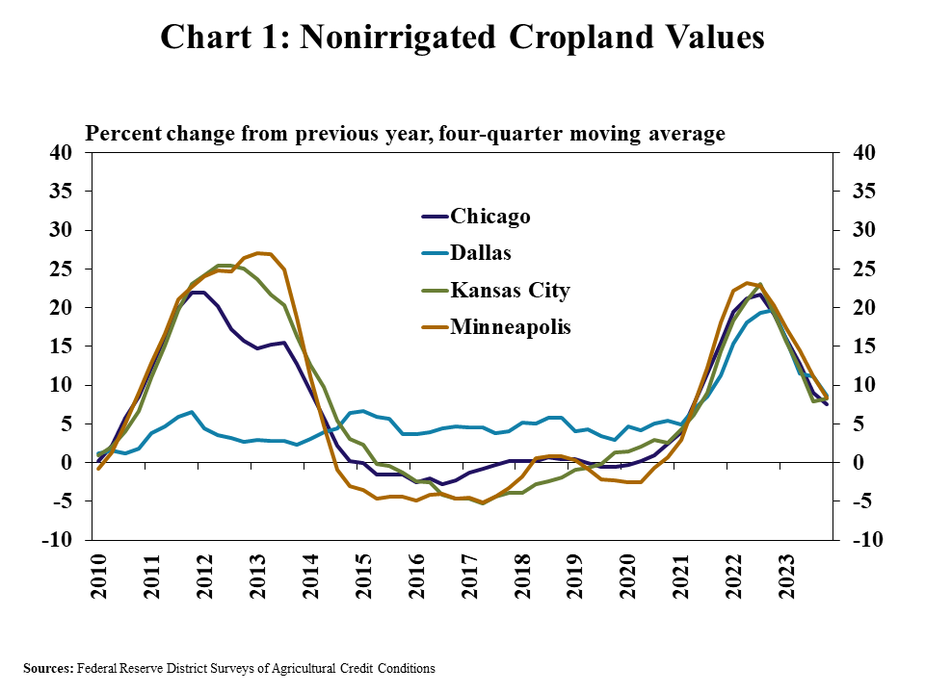
Agricultural real estate values remained strong through the end of 2023 despite a moderation in the farm economy and higher interest rates. According to Federal Reserve District Surveys of Agricultural Credit Conditions, the value of nonirrgiated cropland increased by as much as 10% from a year ago in some regions. The sharp rise in financing costs over the past year and thinner profit margins for many key commodities has the potential to weigh on farmland values, but coming into 2024 those factors have not materially tempered land markets.
Fourth Quarter Federal Reserve District Ag Credit Surveys
Agricultural real estate values remained firm through the end of 2023. The value of nonirrigated cropland increased by an average of nearly 10% over the past year throughout Districts participating in the survey (Chart 1). The growth in farmland values was markedly lower than the previous two years, but remained strong.
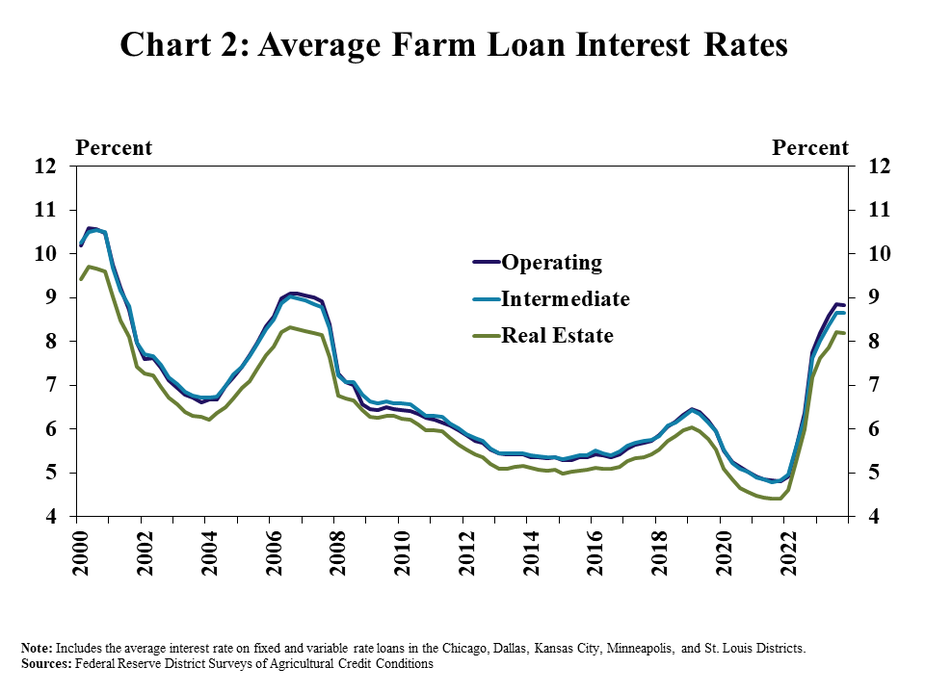
Agricultural real estate values remained solid despite higher interest rates. Average interest rates charged on all types of farm loans were largely flat compared with the previous quarter, but remained at the highest level in more a decade (Chart 2). Higher interest rates have increased financing costs considerably for farm borrowers and could be particularly challenging for producers with large amounts of debt.
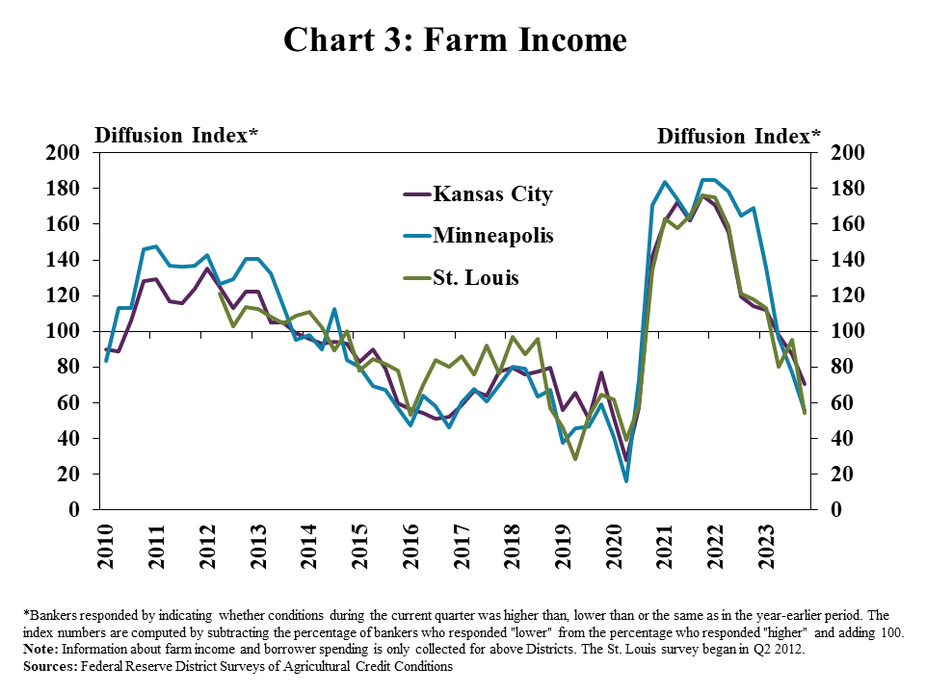
Farmland values have also remained firm despite a moderation in farm financial conditions. Farm income decreased from a year ago according to survey respondents in participating Districts (Chart 3). Profit margins for many producers have thinned over the past year alongside lower prices of key commodities and the share of banks reporting that incomes were lower than a year ago has increased gradually in recent survey periods.
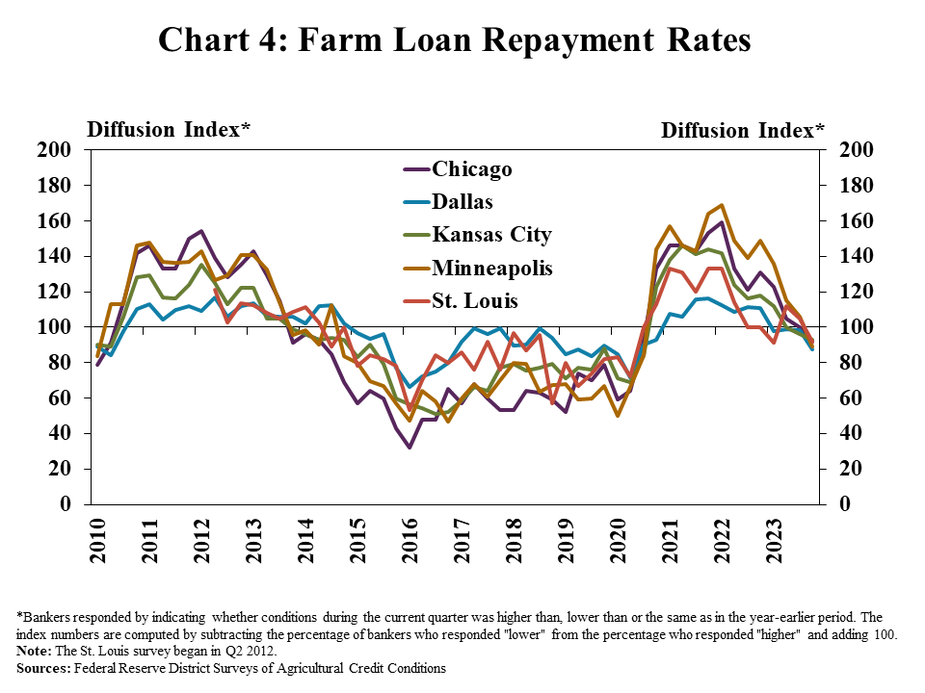
Softening in farm finances put some downward pressure on agricultural credit conditions, but stress remained low. Farm loan repayment rates slowed slightly compared with a year ago in all participating regions (Chart 4). Despite some moderation in rates of repayment over the past year, delinquency rates on farm loans at commercial banks have remained low in recent months.
Data and Information
Excel SpreadsheetFederal Reserve Ag Credit Surveys Historical Data
Excel SpreadsheetFederal Reserve Ag Credit Surveys Tables
External LinkAbout the Federal Reserve Ag Credit Surveys
The views expressed are those of the authors and do not necessarily reflect the positions of the Federal Reserve Bank of Kansas City or the Federal Reserve System.